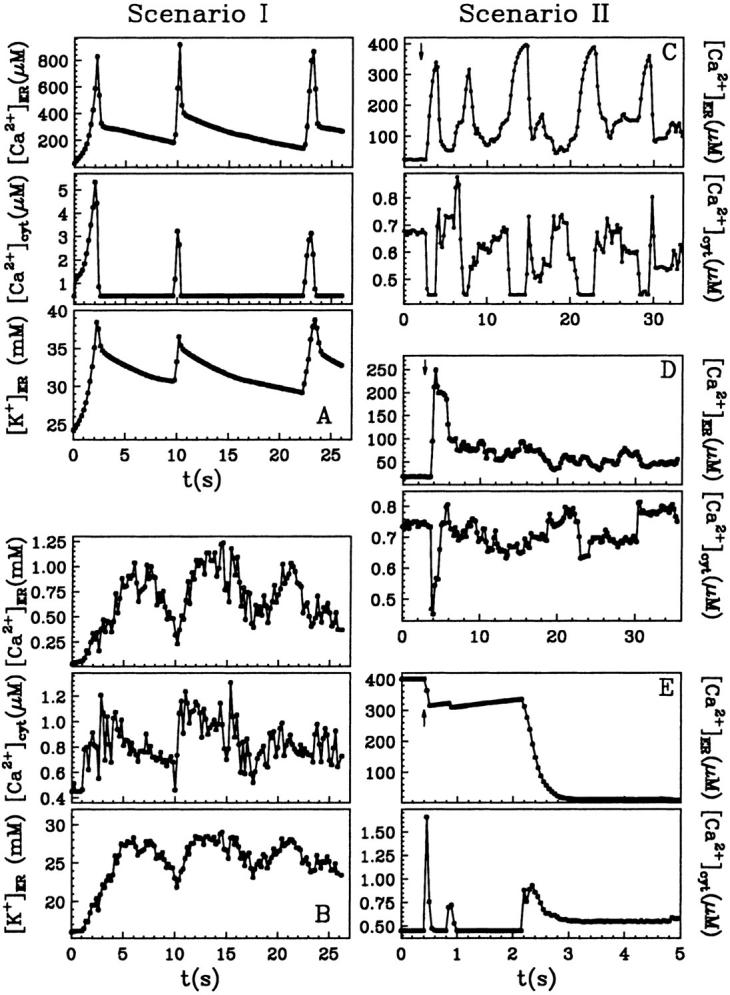
FIGURE 6.

Simulated responses after stimulation of permeabilized cells with 3 μM IP3 at t = 0 in A and B and at moments indicated by arrows in C, D, and E. In C and D, a basal [IP3]b = 30 nM and 100 μM EGTA are considered; otherwise EGTA is present with 40 μM.
