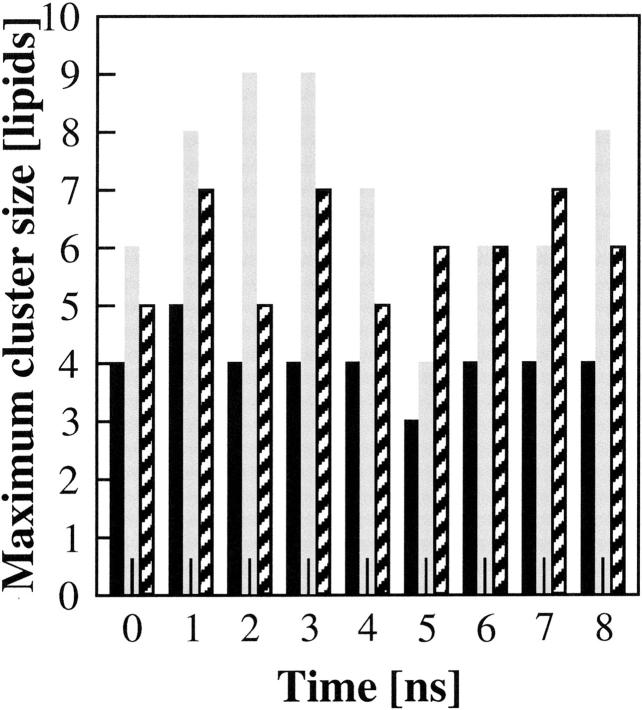
FIGURE 6.
Size of the maximum hydrogen-bonded clusters of lipids within the simulated PSM bilayer in the liquid crystalline phase as a function of time. The cluster size for the MD simulations with the FF1 parameters is indicated in gray, the bars for the FF2 parameters are patterned, and the bars for the FF3 parameters are in black.

