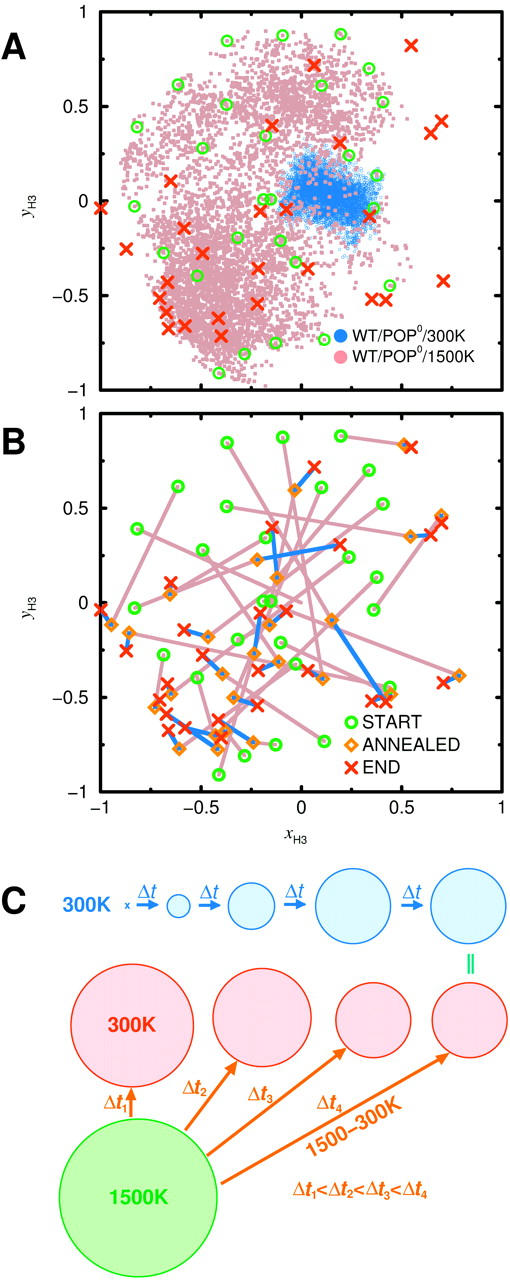
FIGURE 11.

Projection of WT/POP0 H3 helix orientations (unit vectors) onto the xy bilayer plane; the azimuth is plotted relative to the TM helix. (A) 2-ns room temperature trajectory (blue), high-temperature trajectory (brown), selected annealing start structures (green), and obtained annealing and free-dynamics final structures (red). (B) Distances traversed during individual annealing (brown) and equilibration (blue) phases. (C) Sketch of expected convergence behavior of room-temperature dynamics and simulated annealing distributions. The circles symbolize distributions of H3 helix orientations, in a similar representation as A. See text for explanations.
