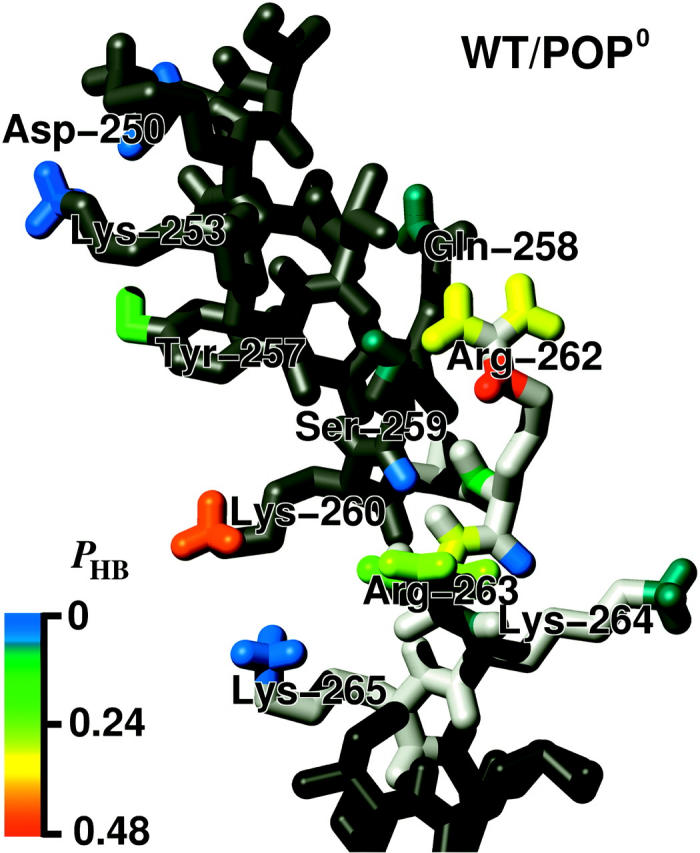
FIGURE 14.

Color-coded probabilities pHB of hydrogen bonds between the H3 helix (gray, top) or the linker region (light gray, mid), respectively, and adjacent lipid molecules (not shown). The structure is taken from the WT/POP0 annealing set (final structure) and is close to the average orientation. Part of the TM helix is shown in dark gray (bottom).
