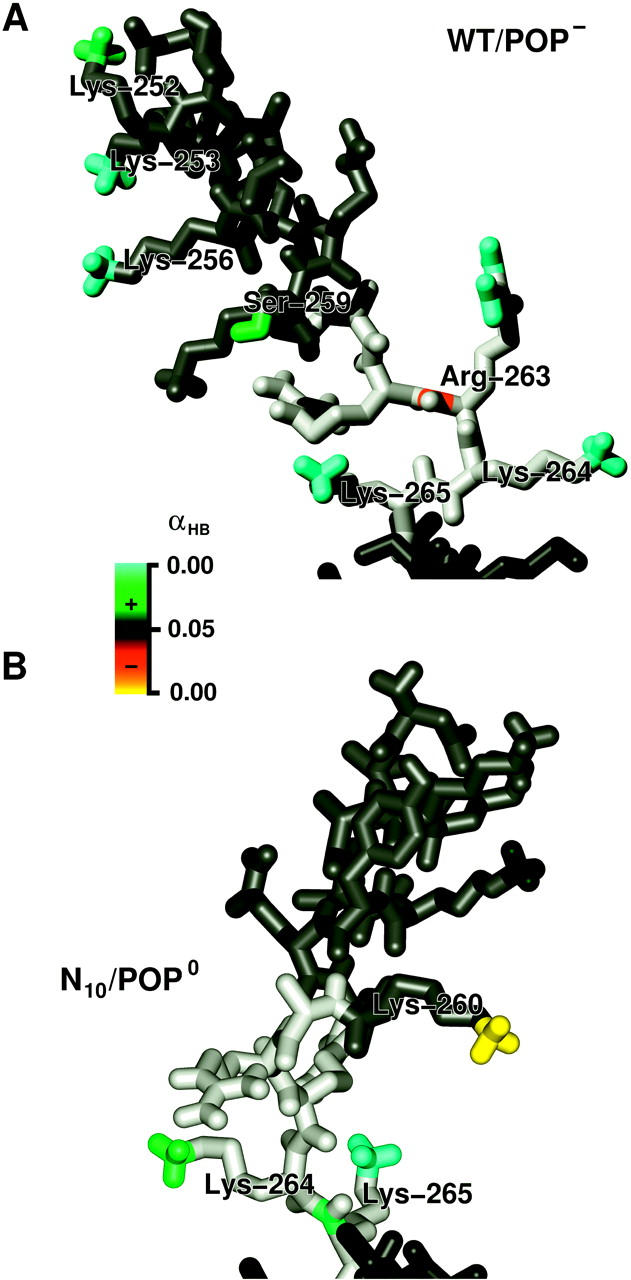
FIGURE 15.

Color-coded significances (p-values) of hydrogen bond probability differences of WT/POP− (top) and N10/POP0 (bottom), compared to WT/POP0, denoting significant (p < 0.5) increase (green), confident (p ≈ 0) increase (cyan), significant decrease (red), and confident decrease (yellow), respectively, as determined by the bootstrap probability test. The structures are taken from the WT/POP− and the N10/POP0 annealing set, respectively, and are close to the respective average orientations. Atoms not involved in hydrogen bonding are shown in gray (H3 helix), light gray (linker), and dark gray (TM region).
