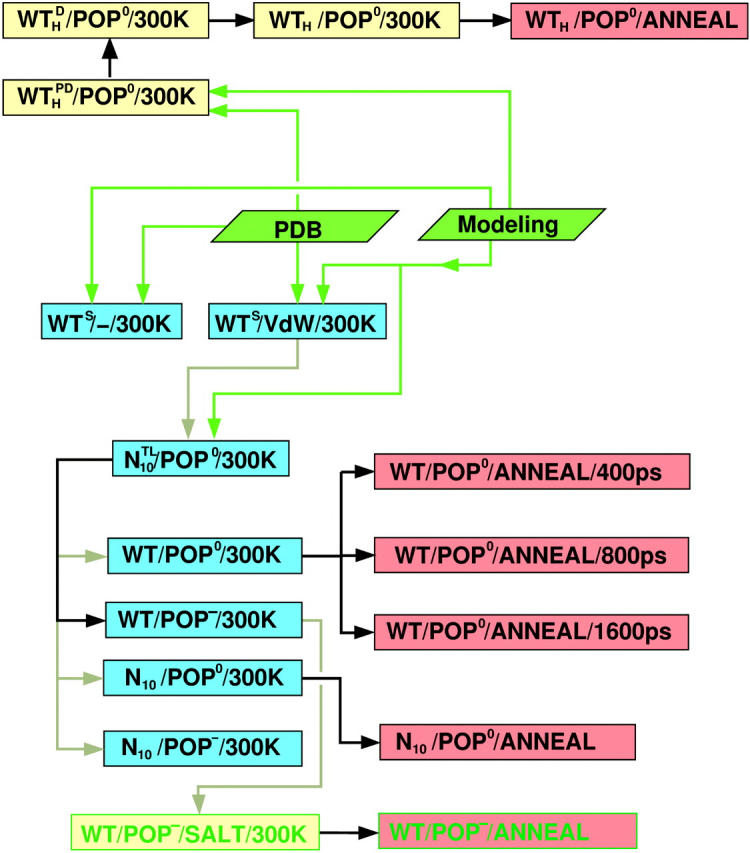
FIGURE 2.

Overview of simulation runs and their mutual interdependencies. Blue (or yellow) and red boxes denote room-temperature runs at T = 300 K (also tagged 300K), and annealing sets (ANNEAL), respectively; green fonts indicate simulations with intracellular salt conditions. Green arrows denote input from the Protein Data Bank or major modeling steps; black and gray arrows indicate that a final configuration has been used as a starting configuration for a subsequent simulation, either without (black) or with (gray) modification. For nomenclature and specification of the various simulation systems, see Table 3.
