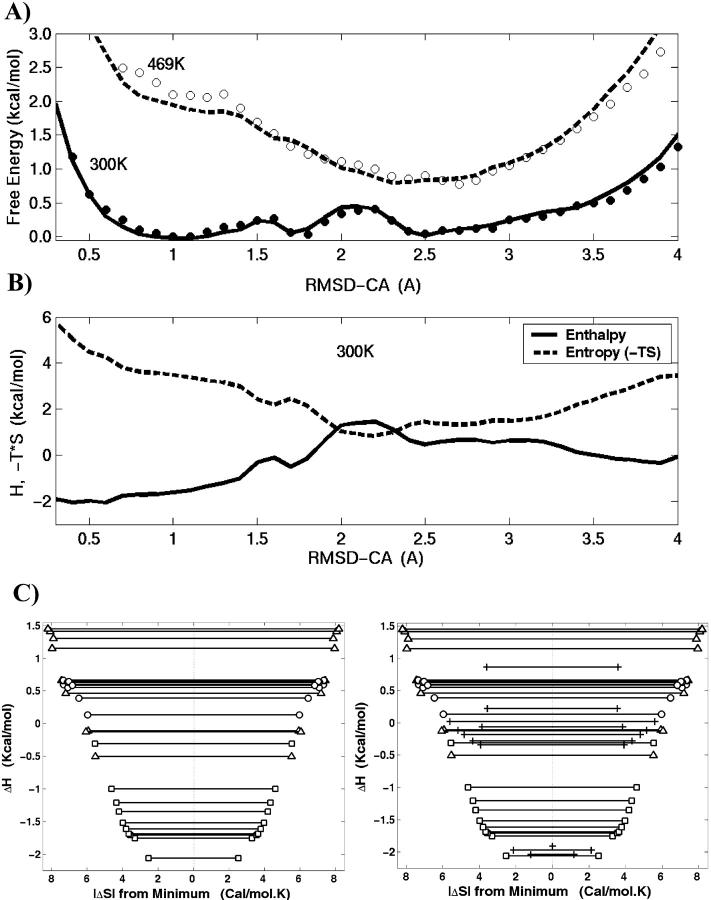
FIGURE 4.
(A) The free energy change at 300 K (solid lines) and 469 K (dashed lines) are plotted along the RMSD-CA coordinate. (B) The enthalpic (solid lines) and entropic (dashed lines) components of free energy at 300 K. The entropy is plotted as −TΔS. (C) The plot of entropy versus enthalpy. The width along the x-axis shows the magnitude of entropy relative to the minimum. The contributions from folded (squares), intermediate (circles), and unfolded (triangles) basins are clarified. The left figure considers the meaningful RMSD-CA range (0.5 A < RMSD-CA < 3.5 A) inasmuch as the extreme RMSD-CA values are associated with very low entropy and high numerical error. The plot on the right is given for comparison which considers the same range as the free energy plots in A and B and the extreme RMSD-CA points are marked +.

