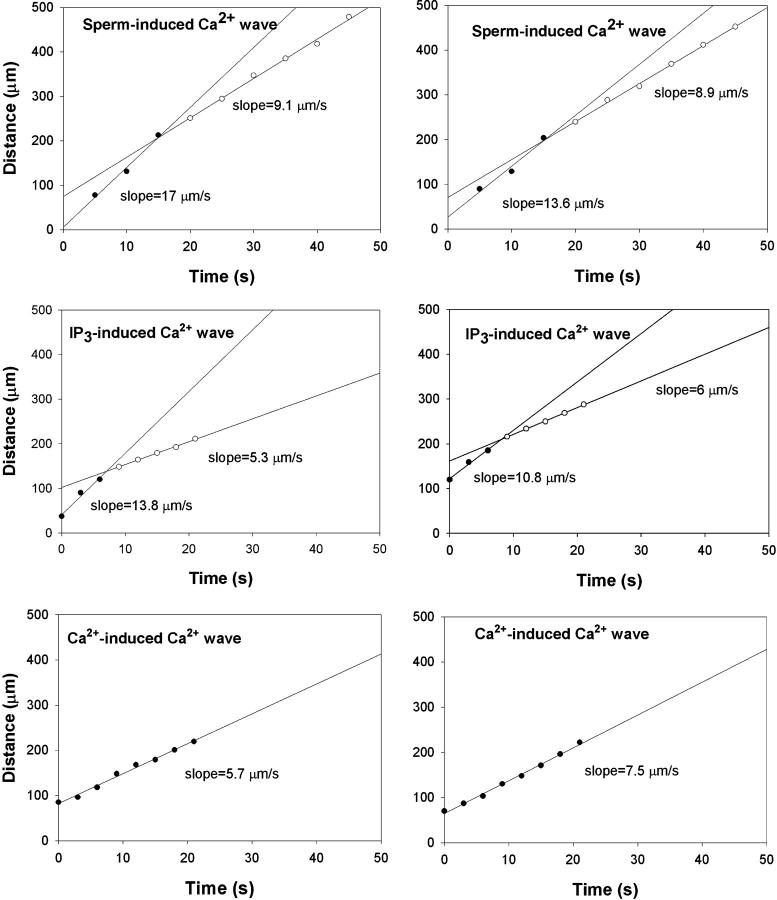
FIGURE 2.
Tangential spread of [Ca2+]i wave over time. Two typical results are shown side by side for each wave type. The data for sperm-induced and IP3-induced waves are best fit by two straight lines of different slopes or velocities. Early time points (filled circles) have a steeper slope or higher velocity than later time points (open circles). In contrast, Ca2+-induced Ca2+ wave propagation is best fit with a single straight line of lower slope or velocity (bottom two examples).

