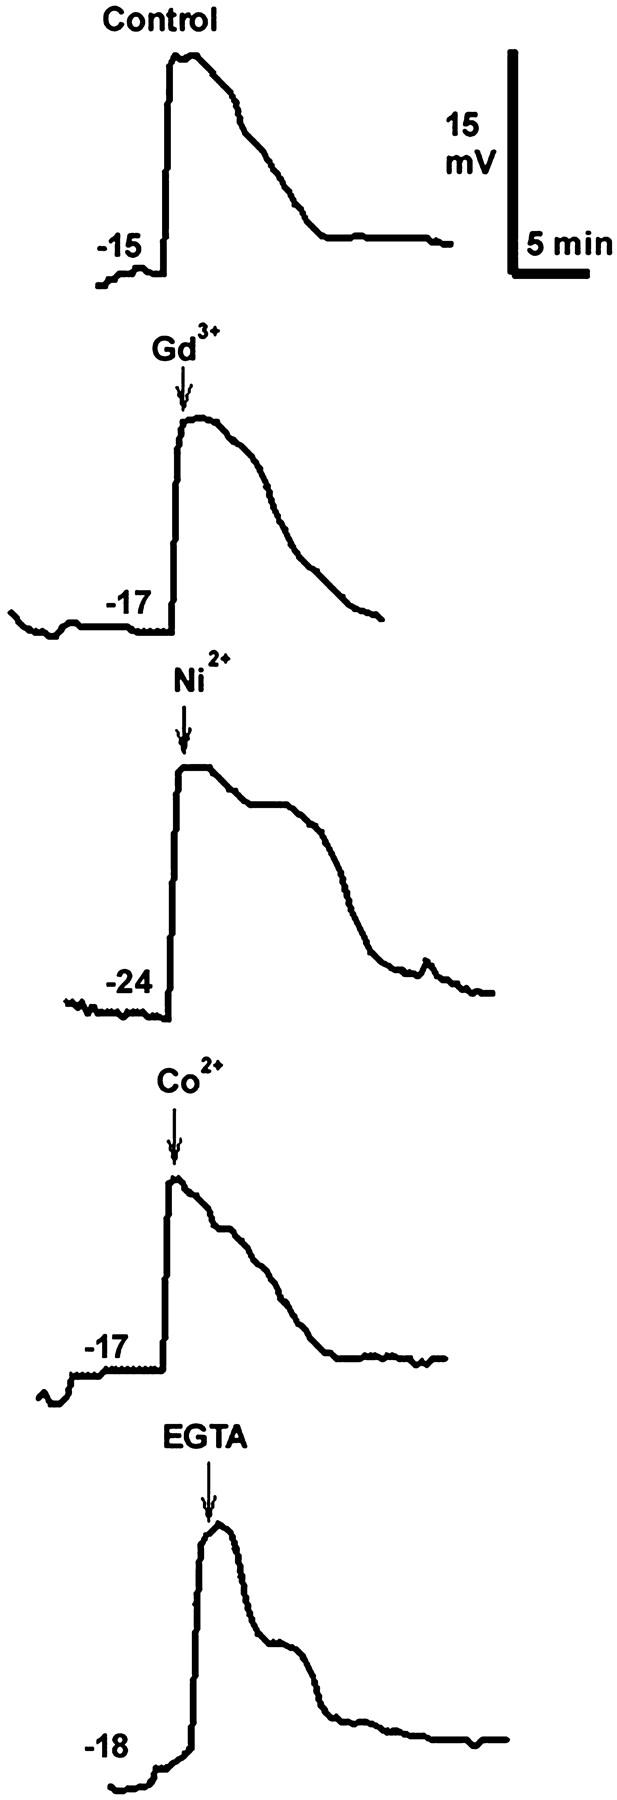
FIGURE 6.

Typical fertilization potentials measured in Xenopus eggs under different conditions. The resting membrane potential (mV) before fertilization is indicated on each recording and the voltage and time scales are on the upper right. At the time indicated by each arrow, the medium containing the indicated blocker or chelator completely replaced the F1 medium in the chamber holding the egg (100 μM Gd3+, 1 mM Ni2+, and Co2+, 5 mM EGTA).
