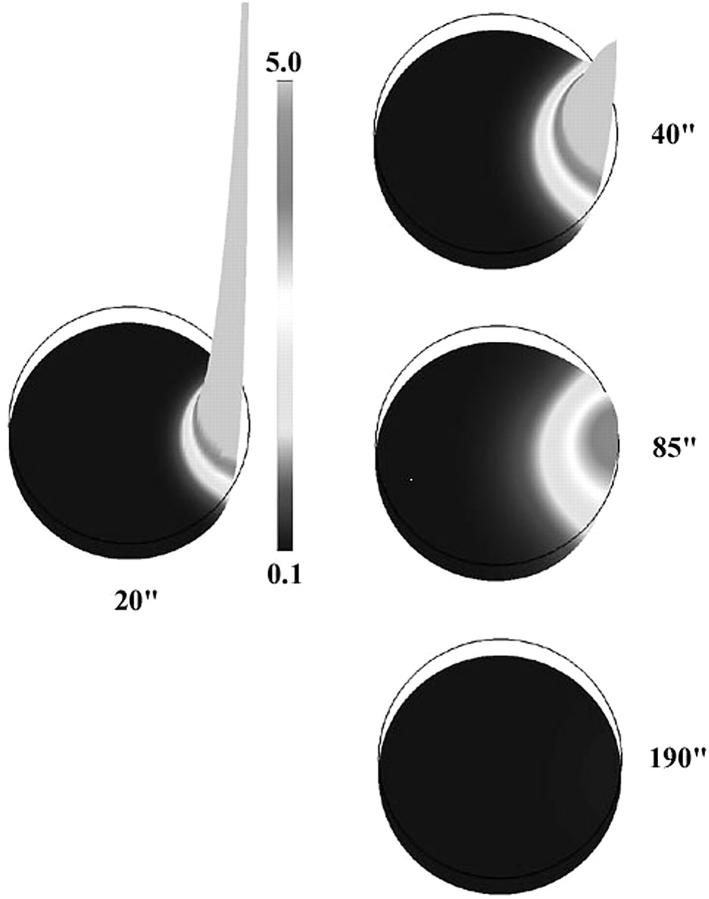
FIGURE 7.
Simulated IP3 profile for the initiation scenario shown on Fig. 8. During first few seconds there is a very high and narrow peak of IP3 concentration (in μM) near fertilization site. As it smoothes out due to diffusion and degradation larger area of elevated IP3 appears (40–90 s). Eventually, IP3 returns to its basal level (190 s).

