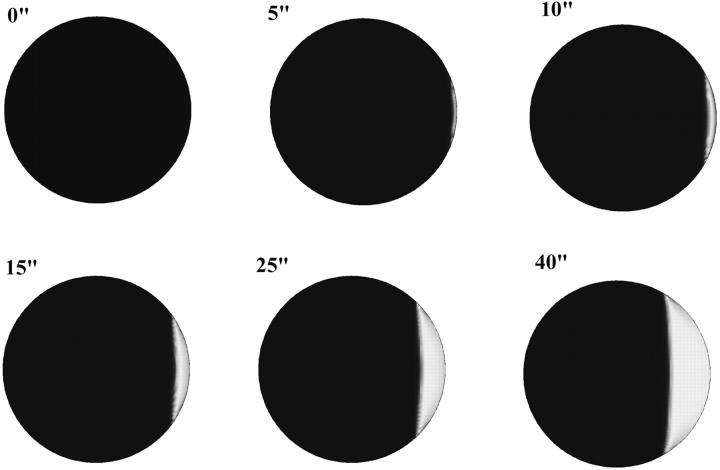
FIGURE 8.
Computer simulations of the wave initiated by rapid production of IP3 near fertilization site. Initial rate of production is 0.06 M/s. Production decays exponentially over 3 s and is spatially limited to a 20 μm circular area on the plasma membrane. The initiation dynamics of this wave appears to be similar to that observed in the experiment. As on Fig. 1, zero time corresponds to the moment just before the first appearance of calcium release. This appears 10 s after start of IP3 production.

