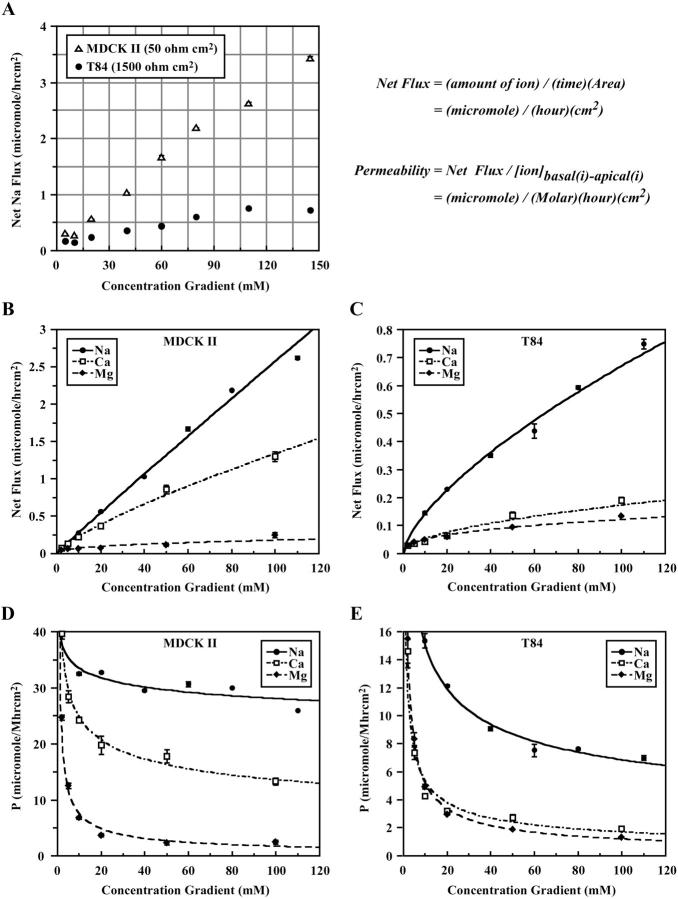
FIGURE 5.
Paracellular Na+, Ca2+, and Mg2+ flux in MDCK II and T84 cells. (A) Na+ flux in MDCK II and T84 cells, as a function of Na+ concentration gradients (n = 3). (B) Na+, Ca2+, and Mg2+ fluxes in MDCK II cells, as functions of concentration gradients. Net sodium flux was calculated by multiplying the concentration of sodium in the final apical solution (molar, M) by its volume (liter, L), divided by the duration of flux (time, h) and the area of the monolayer (cm2), expressed here as μmol/h cm2. Permeability (μmol/M h cm2) is defined here as the net flux divided by the chemical driving force, which has the same unit as the conventional cm/s. (C) Na+, Ca2+, and Mg2+ fluxes in T84 cells, as functions of concentration gradients. (D) Permeabilities of Na+, Ca2+, and Mg2+ in MDCK II cells, as functions of ion concentration gradients. (E) Permeabilities of Na+, Ca2+, and Mg2+ in T84 cells, as functions of ion concentration gradients. For each data point, n = 3.

