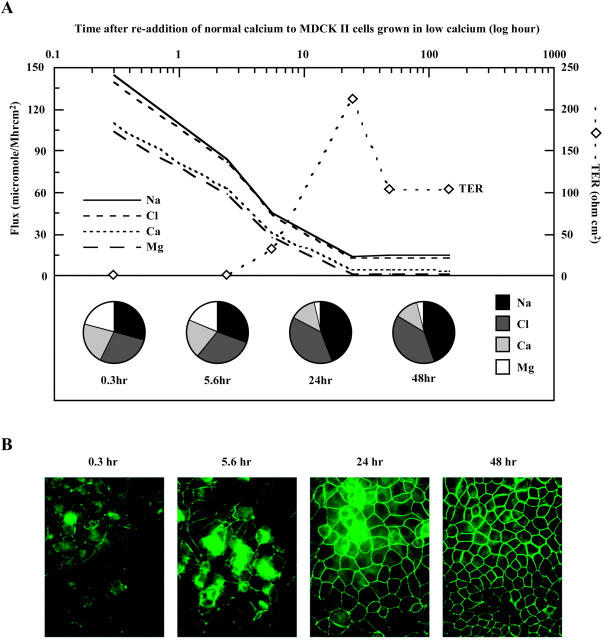
FIGURE 7.
Paracellular ion selectivity required the formation of intact tight junctions. (A) Generation of TER and concomitant decline in paracellular ion fluxes upon tight junction formation by the addition of normal calcium to MDCK II cells (t = 0) that had grown in low calcium medium. Y axis on the left showed ion permeabilities from concurrent tetraionic flux, also displayed as fractional fluxes in pie charts. Y axis on the right showed the corresponding transepithelial electrical resistance (TER). Duplicate monolayers were studied for each time point. The graph was generated using a representative measurement for each time point. (B) Immunofluorescence detection of occludin at various time points after calcium induced tight junction formation.

