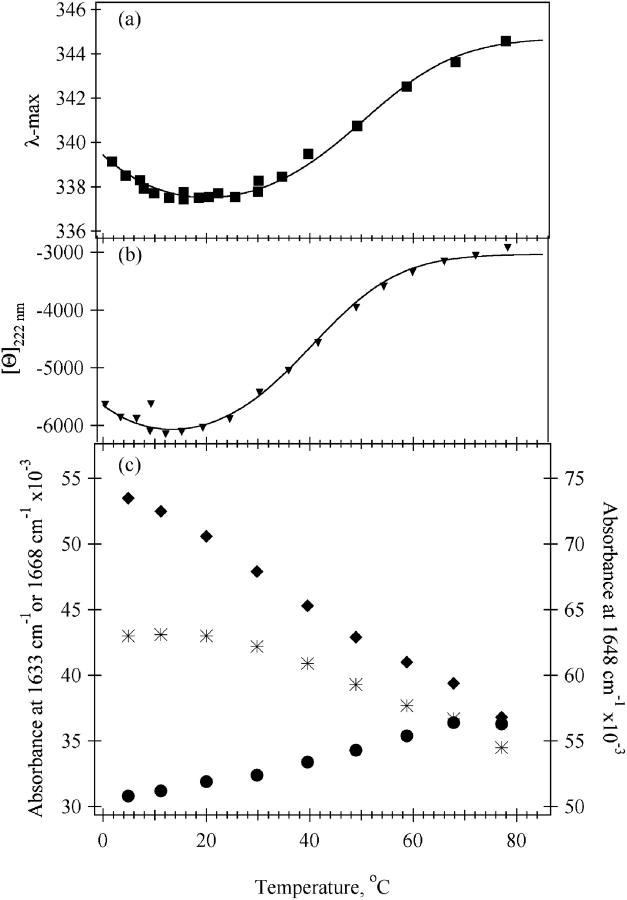
FIGURE 3.
Temperature-dependencies of spectral parameters of sperm whale apomyoglobin at pH* 3.0, 20 mM NaCl. (a) Fluorescence emission maximum position (λmax). (b) molar ellipticity at 222 nm ([Θ]222nm). (c) IR melting transitions at key wavenumbers: 1633 cm−1 (♦), 1648 cm−1 (*), 1668 cm−1 (•). The solid curve in a and b is the van't Hoff analysis fit to the E-form data, taking into account a finite heat capacity change between the folded and unfolded structures (see text).

