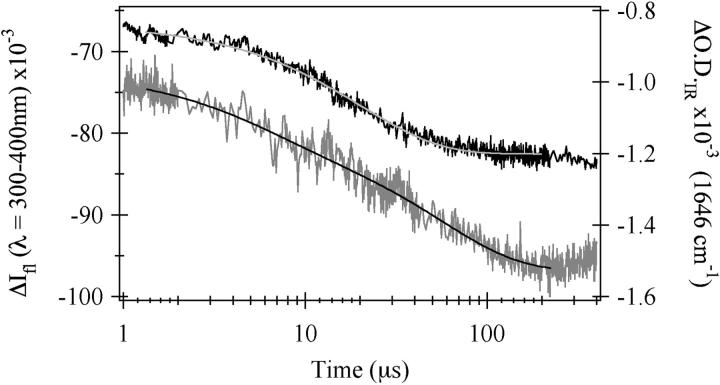
FIGURE 6.
Fluorescence (black) and IR (gray) kinetics traces for the E-form of sperm whale apomyoglobin. The concentration of apomyoglobin in the fluorescence sample was 3.3 mg/ml in pH* 3.0 15 mM NaCl solution and the jump was from 35°C to 52°C. The data is well fit to a single exponential with τ = 20 μs (gray line). For the IR sample, the concentration of apomyoglobin was 4 mg/ml in pH* 3.0 30 mM NaCl. IR changes were monitored at 1648 cm−1 during a jump from 39 to 46°C. The data cannot be fit with a single exponential but is well fit by a double exponential with τ1 = 5 μs and τ2 = 56 μs (black line).

