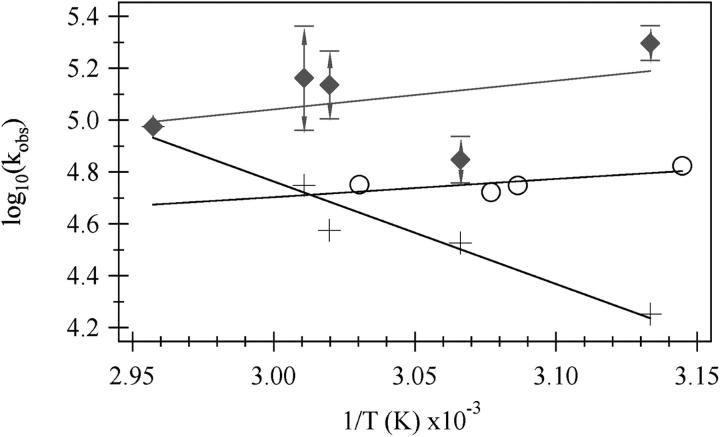
FIGURE 7.
Arrhenius plot showing the temperature dependence of the phases. The values of T used for the (1/T) axis are the final temperatures reached during the jump. kobs is the value obtained from a single exponential fit of the fluorescence (o) or a constrained double exponential fit of the infrared (+, ♦) T-jump data. The 46°C data was fit to a unconstrained double exponential. Then the ratio of the two phases found for the 46°C data was used to constrain the double exponential fit for the other curves. The error bars on the fast phase of the IR data were determined by taking the standard deviation of the rate constants from several constrained and unconstrained double exponential fits to the data and then adding or subtracting this number from the value of the datapoint.

