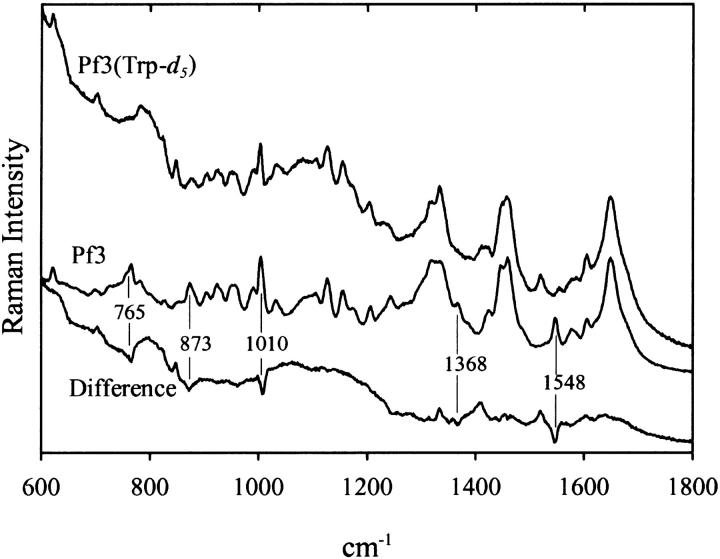
FIGURE 2.
Raman spectra (600–1800 cm−1, 514.5-nm excitation) of solutions of unlabeled Pf3 virus (middle trace) and labeled Pf3 virus containing deuteriotryptophan (Trp-d5) at subunit residue 38 (top trace). The normalized difference spectrum is also shown (bottom trace). Samples were prepared at ∼100 mg/mL in 10 mM Tris at pH 7.8 and data were collected at 20°C.

