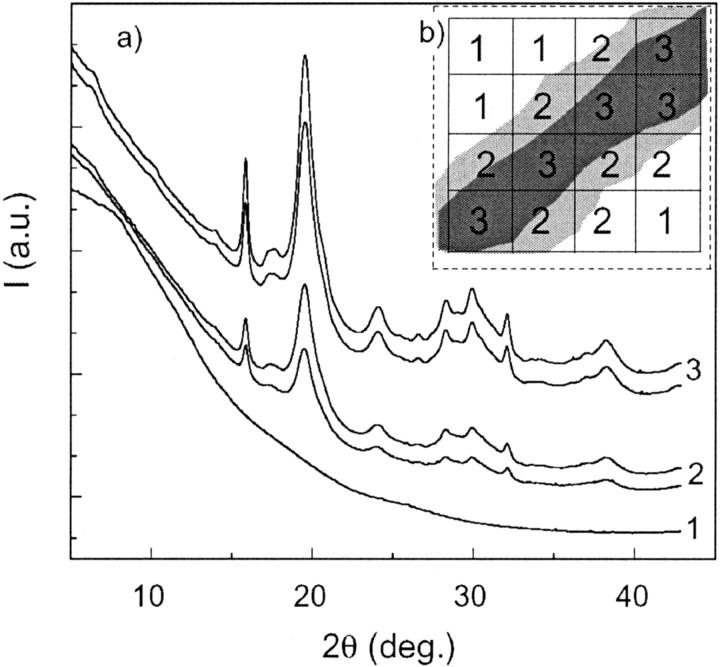
FIGURE 6.
(a) μ-XRD patterns relative to different selected areas of the bone sample. (b) Schematic of the scanning procedure: diffractograms labeled 1 are collected from the intertrabecular region, those labeled 2 are collected from the trabecular surface, and those labeled 3 are collected from the inner region of the trabecula.

