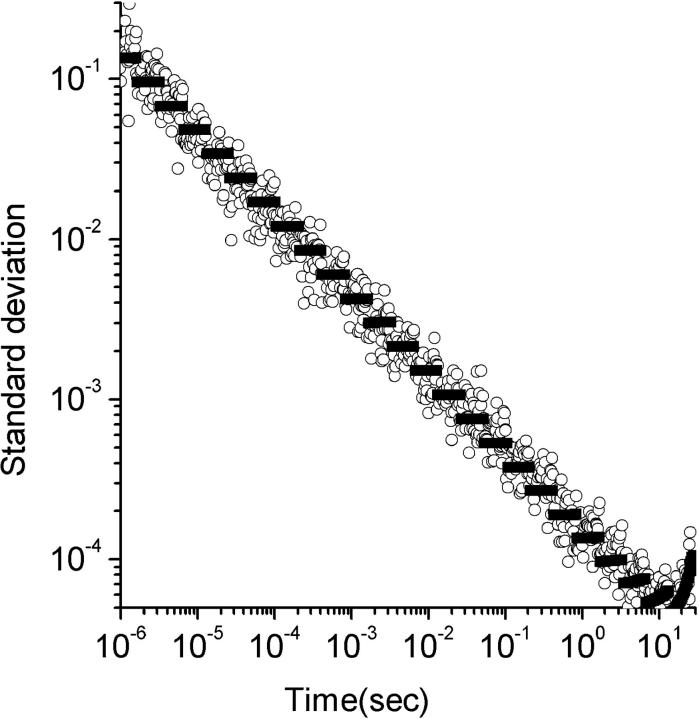
FIGURE 2.
Theoretical and experimental variance for shot noise. The standard deviation is plotted versus lag times. The circles are standard deviations measured from an experimental sample as discussed in the text and the black data points are theoretical predictions from Eq. 31. The standard deviations in this experiment were completely dominated by shot noise. The experiments were performed for 30 s and were repeated 10 times for standard deviation calculations.

