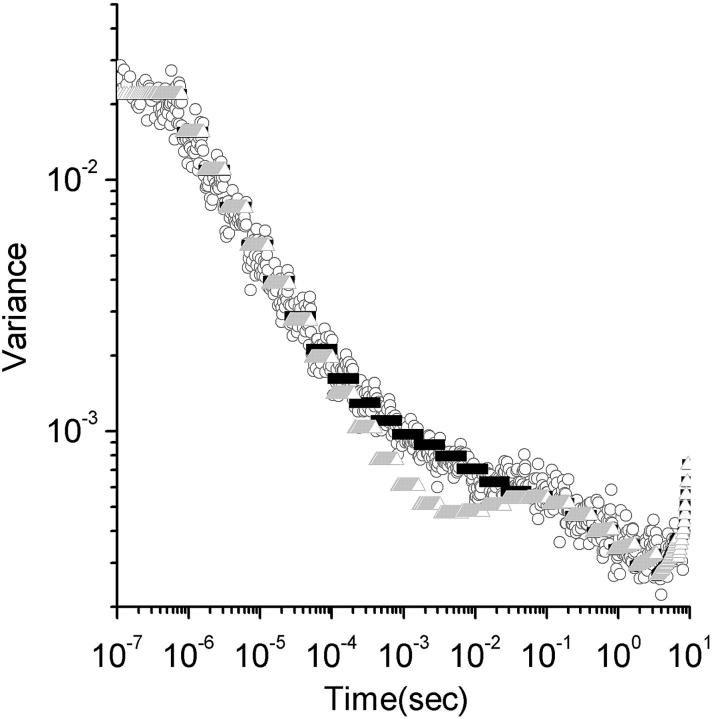
FIGURE 3.
Theoretical and experimental variance including all noise contributions. The standard deviation versus lag time for a sample of 150-kDa Dextran molecules labeled with fluorescein. The experimental points are presented as circles. The complete analytical noise calculation are represented by the black triangles. The gray triangles are the predicted standard deviation from shot noise and particle noise without contributions from correlated fluctuations noise (Eq. 33). The theoretical points appear as black and gray bars due to their density.

