
FIGURE 11.
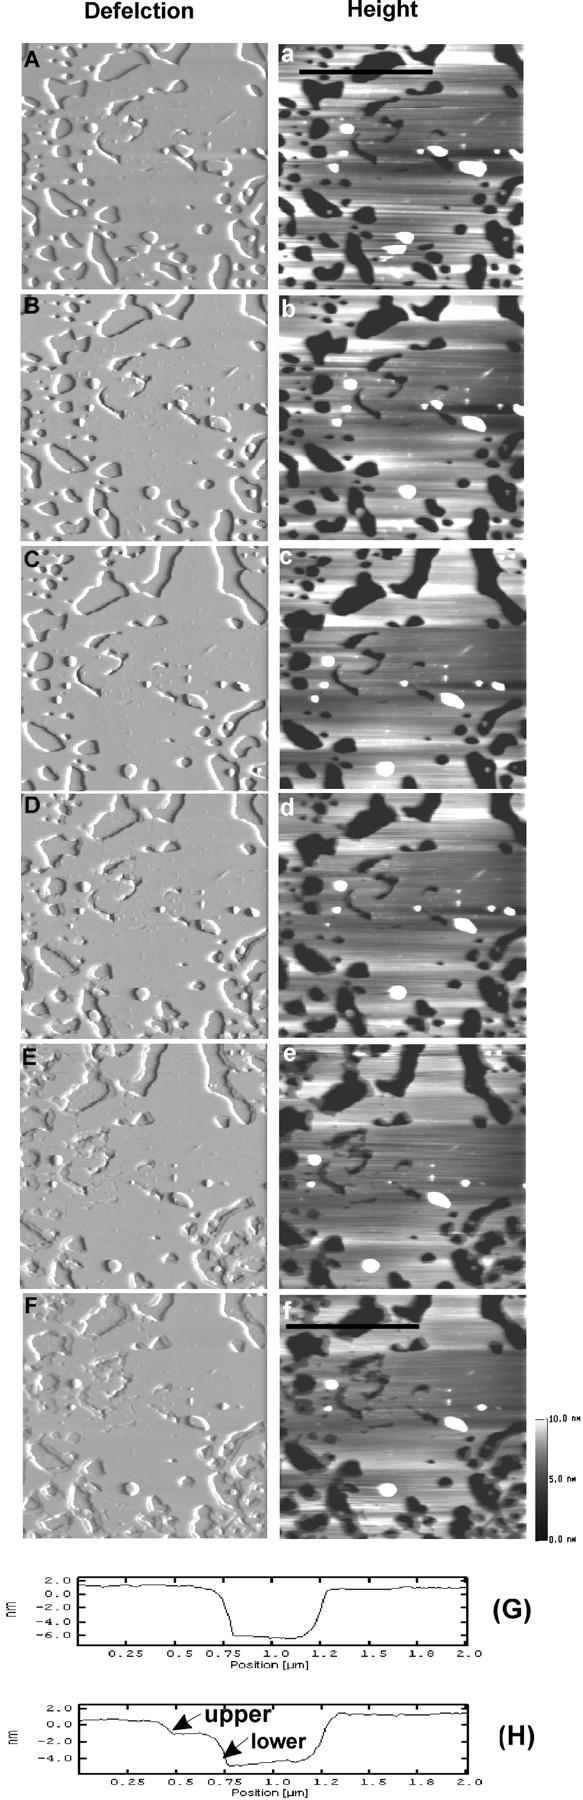
Time-sequence of AFM deflection (A–F) and height (a–f) images of DSPC/POPS (molar ratio 10:2.5) phospholipid membranes on mica with sequential addition of H1 and H2 peptides. Images were obtained at (A, a) 0 min, (B, b) 12 min, (C, c) 29 min, (D, d) 39 min, (E, e) 71 min, and (F, f) 92 min. At the end of obtaining image (A, a), 9.84 μM H1 peptide was added and at ∼33 min, 10.02 μM H2 peptide was added. (G and H) Line profiles taken from the positions indicated by the black line in images (a) and (f), respectively. Thickness of the upper and lower layers was measured at 1.73 ± 0.30 nm and 3.09 ± 0.43 nm (n = 65), respectively. Image size: 4 × 4 μm.