
FIGURE 12.
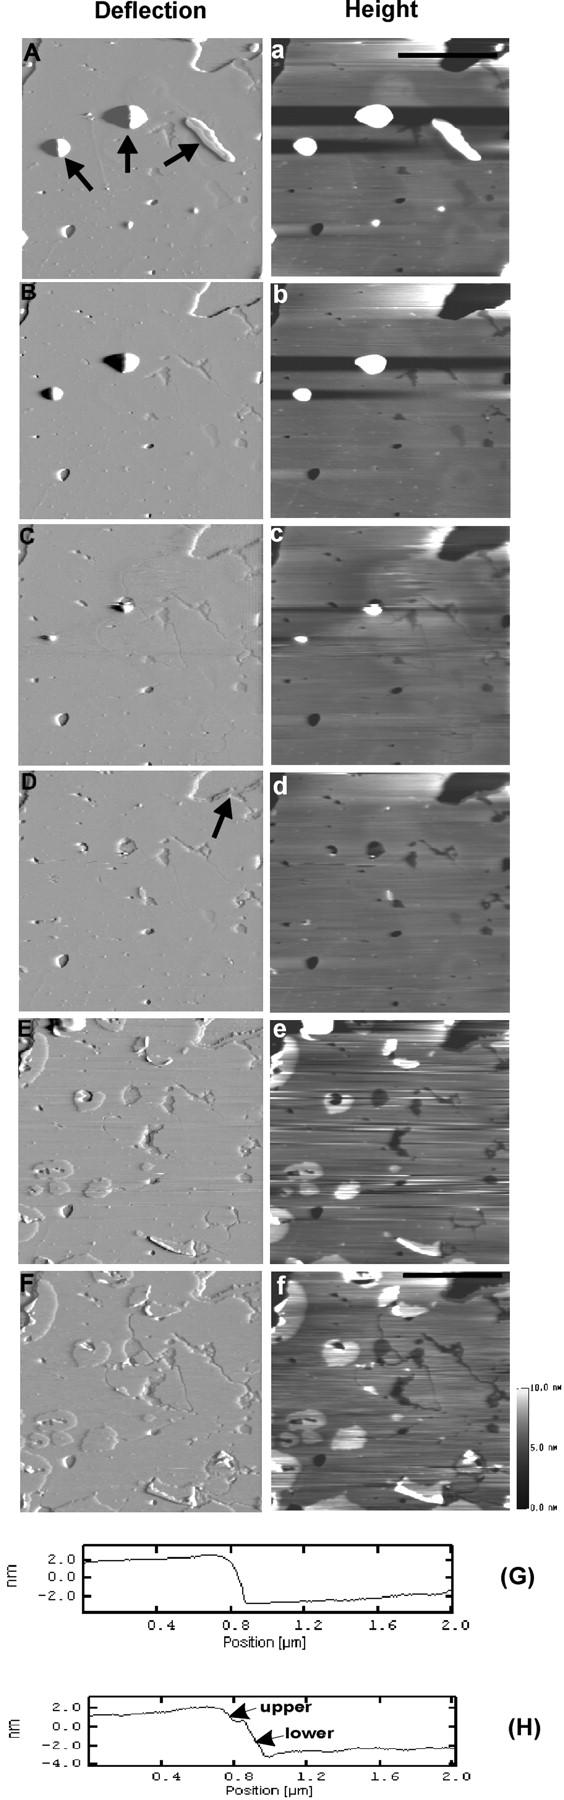
Time-sequence of AFM deflection (A–F) and height (a–f) images of DSPC/POPS (molar ratio 10:5) phospholipid membranes on mica with sequential addition of H1 and H2 peptides. Images were obtained at (A, a) 0 min, (B, b) 27 min, (C, c) 34 min, (D, d) 42 min, (E, e) 89 min, and (F, f) 119 min, respectively. At the end of obtaining image (A, a), 9.84 μM H1 peptide was added and at ∼34 min, 10.02 μM H2 peptide was added. In A, the black arrows indicate two large and one small piece of vesicle aggregate, which disappeared under continued AFM scanning. The black arrow in D indicates the appearance of membrane destabilization, as two layers appear. G and H Line profiles taken from the positions indicated by the black line in images (a) and (f), respectively. Thickness of the upper and lower layers was measured at 1.59 ± 0.22 nm and 3.79 ± 0.23 nm (n = 110), respectively. Image size: 5 × 5 μm.