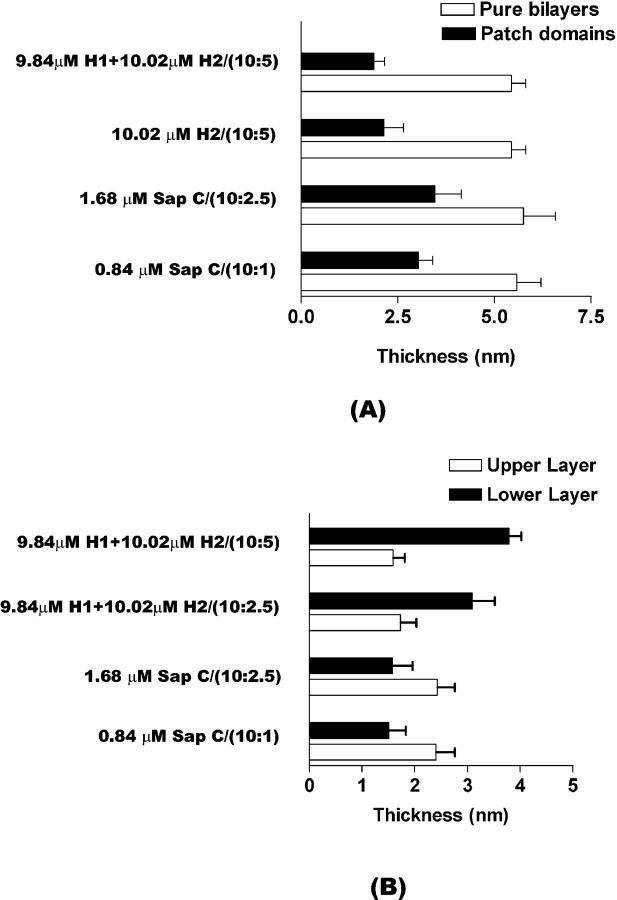
FIGURE 13.
Thickness of the patchlike domains (A) and thickness of the upper and lower layers (B). (A) The thickness measurements of the patchlike domains (solid bars) were taken from the complete series of AFM images presented in Figs. 2, 3, 10, and 12, respectively. Thickness of pure DSPC/POPS membrane bilayers (open bars) at molar ratios of 10:1, 10:2.5, and 10:5 is also given. (B) The thickness measurements of the upper (open bars) and lower (solid bars) layers were taken from the complete series of AFM images not presented and presented in Figs. 3, 11, and 12, respectively.

