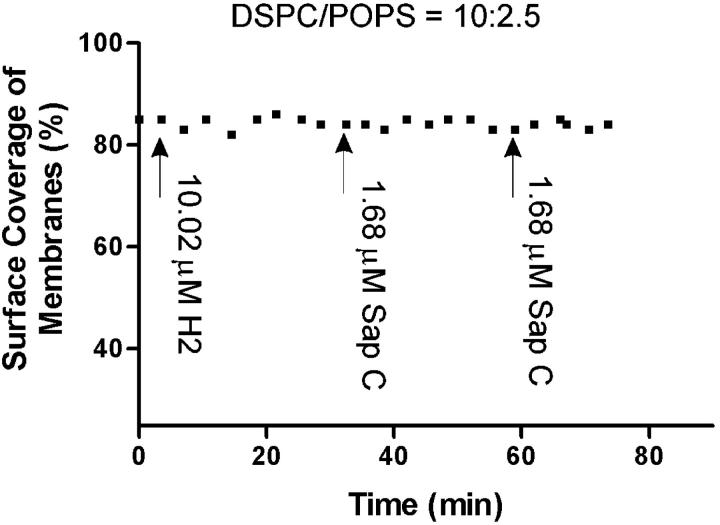
FIGURE 9.
Quantitative presentation of H2 peptide and Sap C effects on DSPC/POPS (molar ratio 10:2.5) phospholipid membranes, showing the inhibition of Sap C-induced membrane destabilization by H2 peptide. The surface coverage (%) of the membrane at each time point was calculated and plotted. Arrows indicate the time of addition of H2 peptide and Sap C, respectively.

