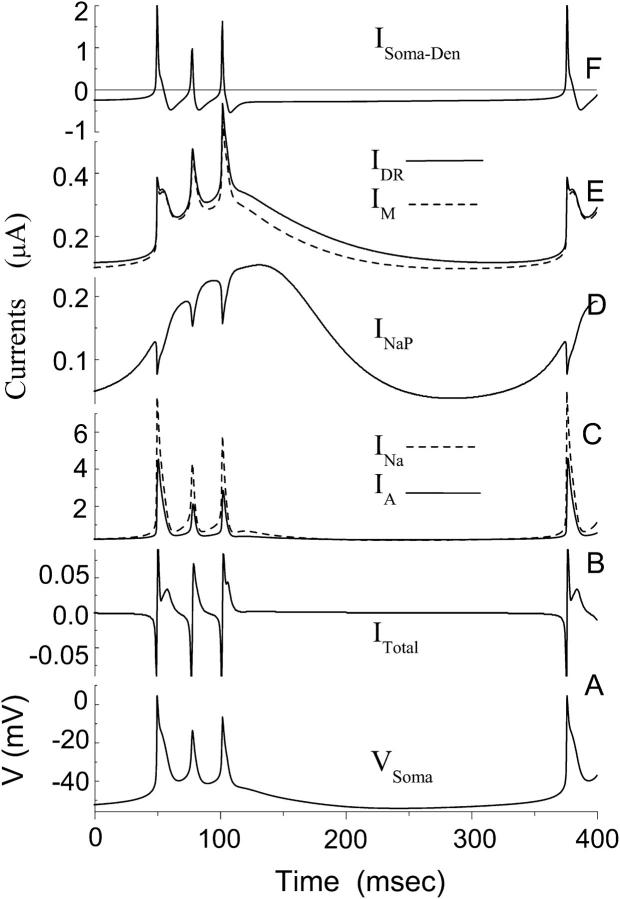
FIGURE 4.
Detailed curves of various currents during a burst for the CA1 model. (Bottom to top) (A) The transmembrane potential in the somatic compartment. (B) The total current ITotal in the somatic compartment. (C) The dominant inward currents INa with dashed line and the dominant outward current IA with solid line. (D) Persistent sodium current INaP. (E) The potassium currents IDR with solid line and IM with dashed line. (F) The axial current ISoma-Den between the somatic compartment and the two neighboring dendritic compartments. Five of six peaks for current ITotal in B are clipped by the frame. The first peak for current ISoma-Den in F is also clipped.

