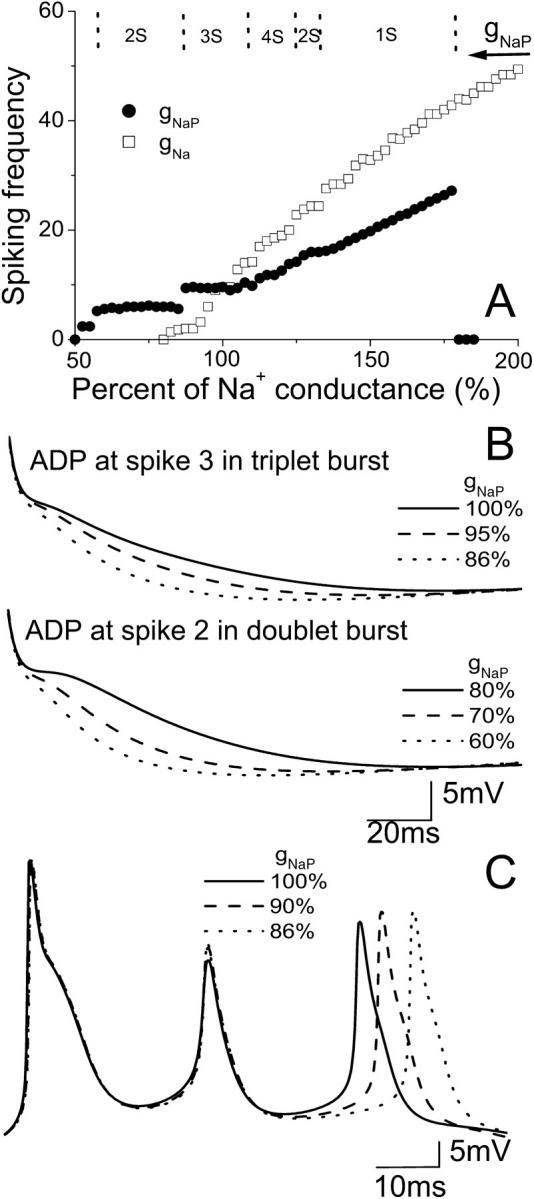
FIGURE 6.

(A) Spiking frequency of the CA1 model with the change in conductance gNaP (circle) and gNa (square). Too large or too small gNaP blocks spiking activity. In the upper part of A, the typical regions of different spiking number per burst are shown for the change of gNaP. (B) A decrease of gNaP results in a reduction of the prolonged ADP after the action potentials in a triplet or doublet burst. (C) A notable delay in the appearance of the third spike for the burst is induced by a decrease of gNaP.
