
FIGURE 9.
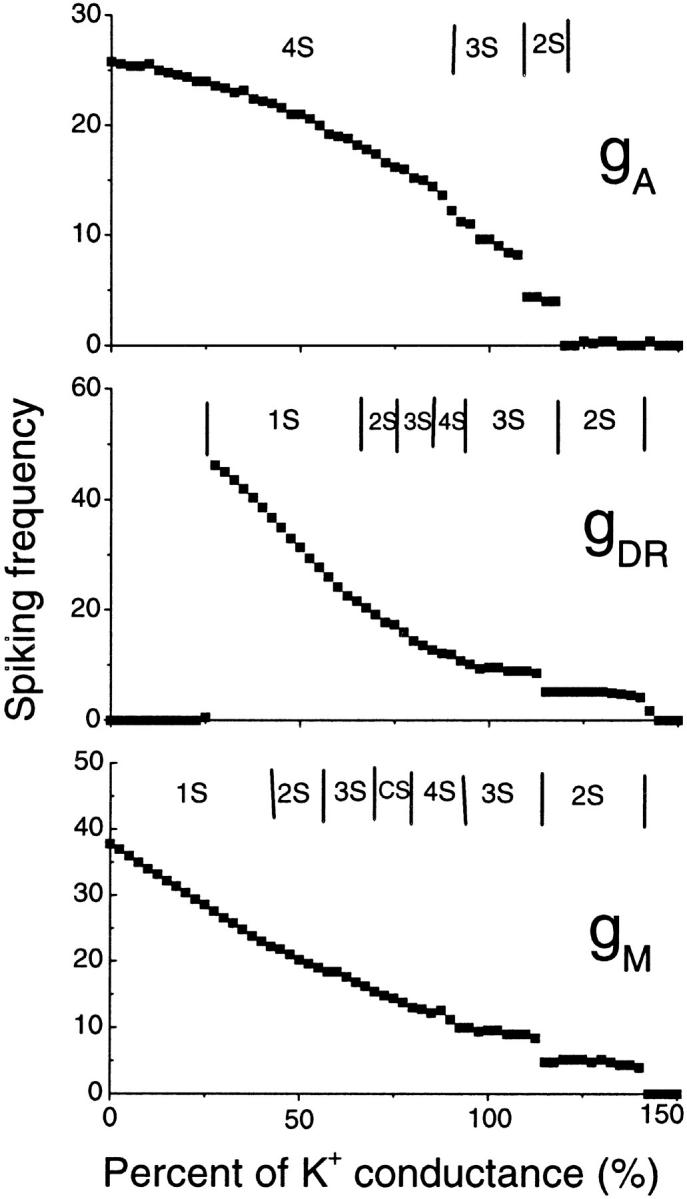
Spiking frequency of the CA1 model with the change in conductance gA, gDR, and gM of potassium currents. A decrease of potassium current conductance results in an increase of the spiking frequency in a certain region. In each figure, the typical regimes with different burst modes are also indicated.