
FIGURE 2.
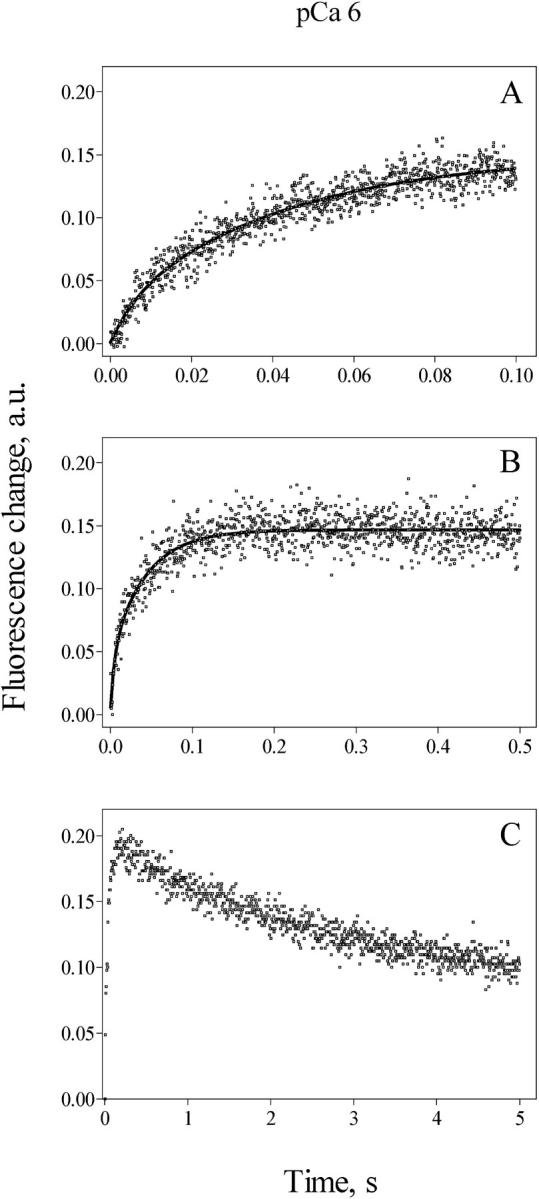
Calcium release kinetics determined at pCa 6. Cardiac SR vesicles (1 mg/ml) actively loaded with calcium were mixed (1:10) in a stopped flow fluorescence spectrometer with a solution designed to obtain after mixing 1.2 mM free [ATP] and pCa 6, as detailed in the text. Calcium release, measured as the change in fluorescence of Calcium Green 5N, followed a double exponential function. Values of k1 = 110 s−1 and k2 = 20 s−1 were obtained in the 0.1 s record illustrated in A. Values of k1 = 110 s−1 and k2 = 22 s−1 were obtained from the 0.5 s record illustrated in B. (C) Calcium release and recapture are shown in a record lasting 5 s. Records represent the average of five to eight determinations.