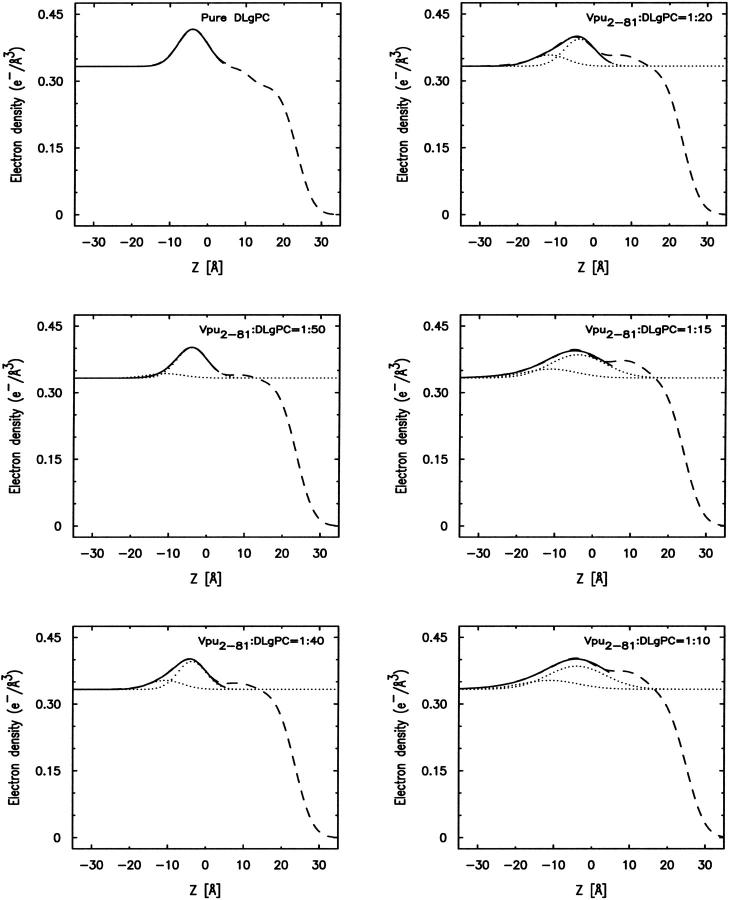
FIGURE 10.
Best nonlinear least-squares fits of two Gaussian functions, representing the protein's cytoplasmic domain and the phospholipid headgroups, to the excess electron density within the asymmetric polar headgroup region of the absolute electron density profiles ρ(z) obtained via analytic integration as described in the text, for the mixed Vpu/DLgPC monolayers as a function of increasing Vpu/DLgPC mole ratio at a surface pressure of 45 mN/m and T = 20°C.

