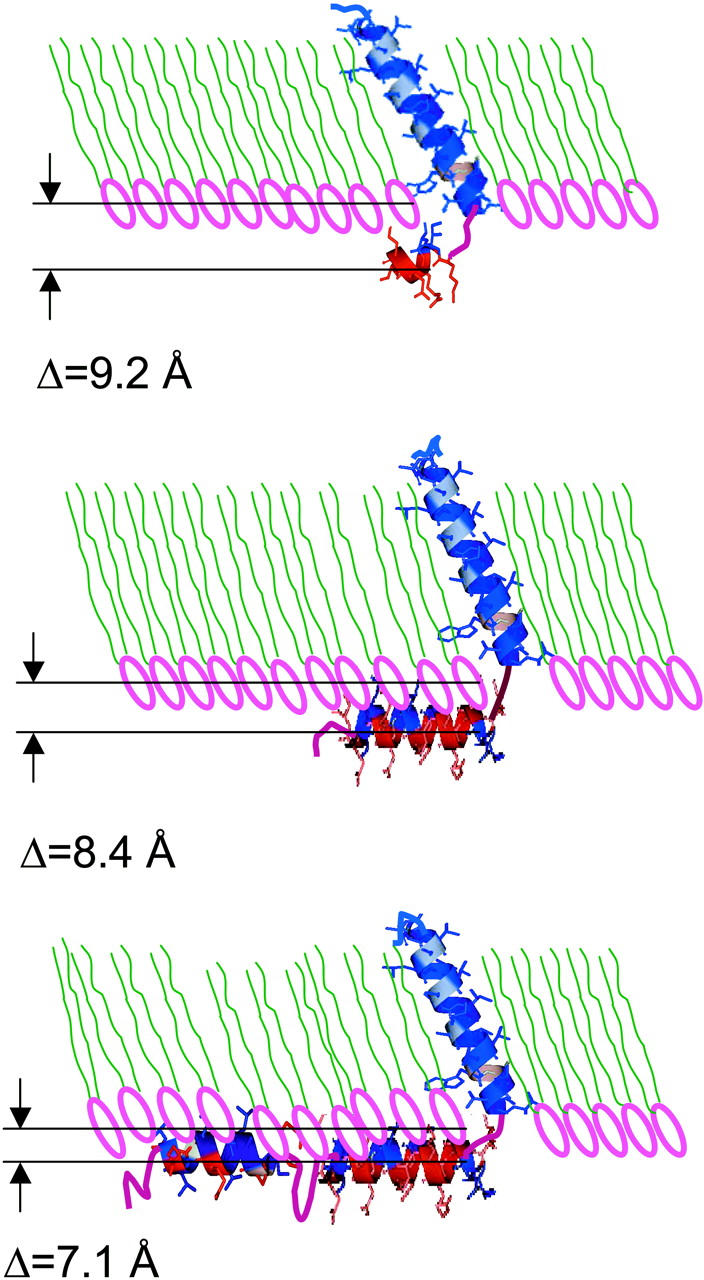
FIGURE 12.

Schematic showing the known secondary structures of Tm (Vpu2–37), TmCy (Vpu2–51), and Vpu (Vpu2–81), incorporated into the host DLgPC monolayer fully consistent with the quantitative analysis of the polar headgroup region in the electron density profiles for the various mixed monolayers over the range of protein/lipid mole ratios of 1:∞, 1:50, 1:40, 1:20, 1:15, and 1:10 at a surface pressure of 45 mN/m and T = 20°C.
