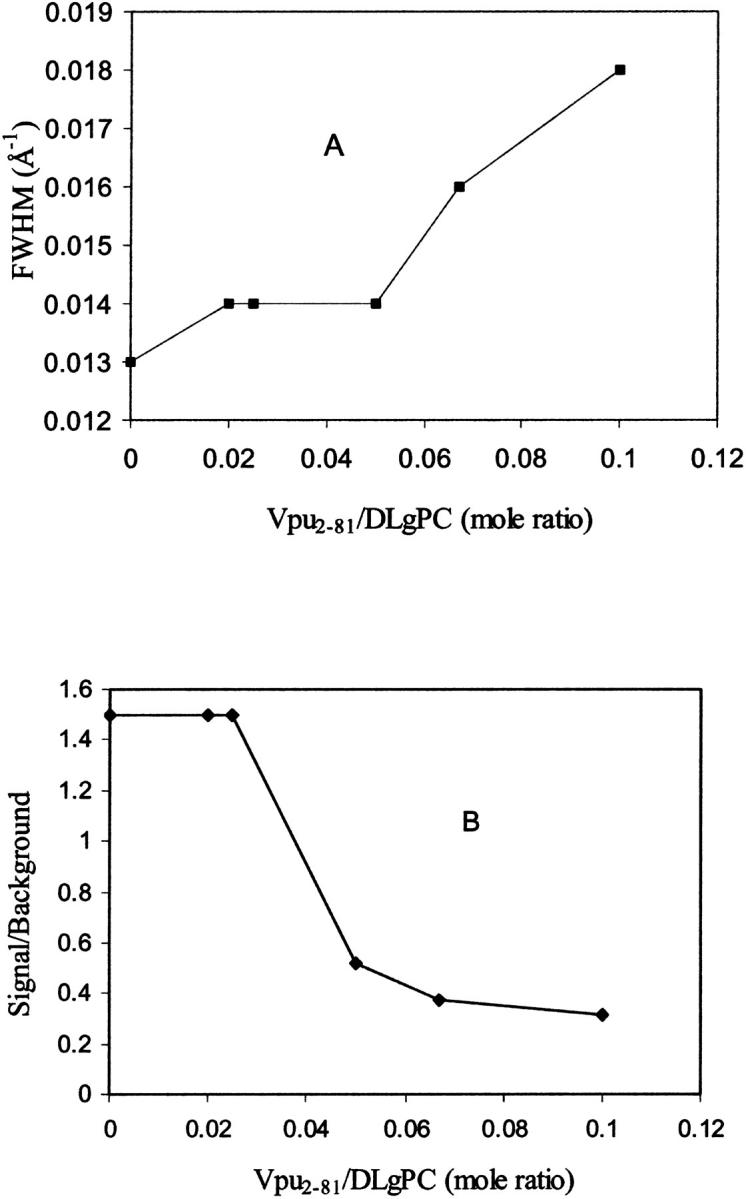
FIGURE 4.

Halfwidths (A) and amplitudes, expressed as signal/background ratios (B), extracted from the best fits of the Lorentzian line shapes to the GID data shown in Fig. 3 for various Vpu/DLgPC mole ratios. Note that the range of values for these two parameters shown on the respective ordinates in these plots does not include zero. Entirely similar results were also obtained for Tm/DLgPC mixed monolayers over the same range of mole ratios (not shown).
