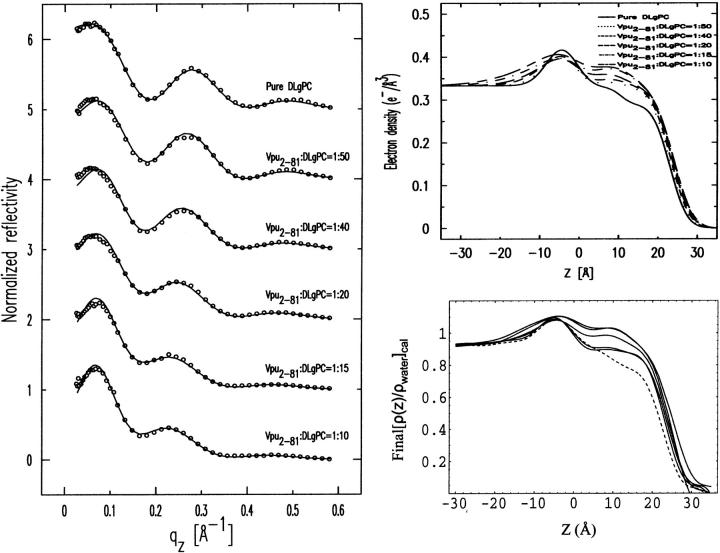
FIGURE 7.
(Left side, criteria a) Experimental R(qz)/RF(qz) data are shown as circles for the case of Vpu at DLgPC/Vpu mole ratios of ∞, 50:1, 40:1, 20:1, 15:1, and 10:1.and the |F(q′z)|2, calculated via Eq. 1 for the best nonlinear least-squares fits of the sum of four Gaussian functions to the gradients of the monolayer electron density profiles dρ(z)/dz from Box Refinement, are shown as the solid lines. (Right side, criteria b) The top half shows the absolute electron density ρ(z) profiles calculated by analytic integration of the best nonlinear least-squares fits of the sum of four Gaussian functions to the gradients of the monolayer electron density profiles dρ(z)/dz from Box Refinement for the case of Vpu at DLgPC/Vpu mole ratios of ∞, 50:1, 40:1, 20:1, 15:1, and 10:1. The bottom half shows the absolute electron density ρ(z) profiles calculated by numerical integration of the gradients of the monolayer electron density profiles dρ(z)/dz from Box Refinement for this case. The corresponding figures for the proteins Tm and TmCy are shown in Appendix B.

