
FIGURE 4.
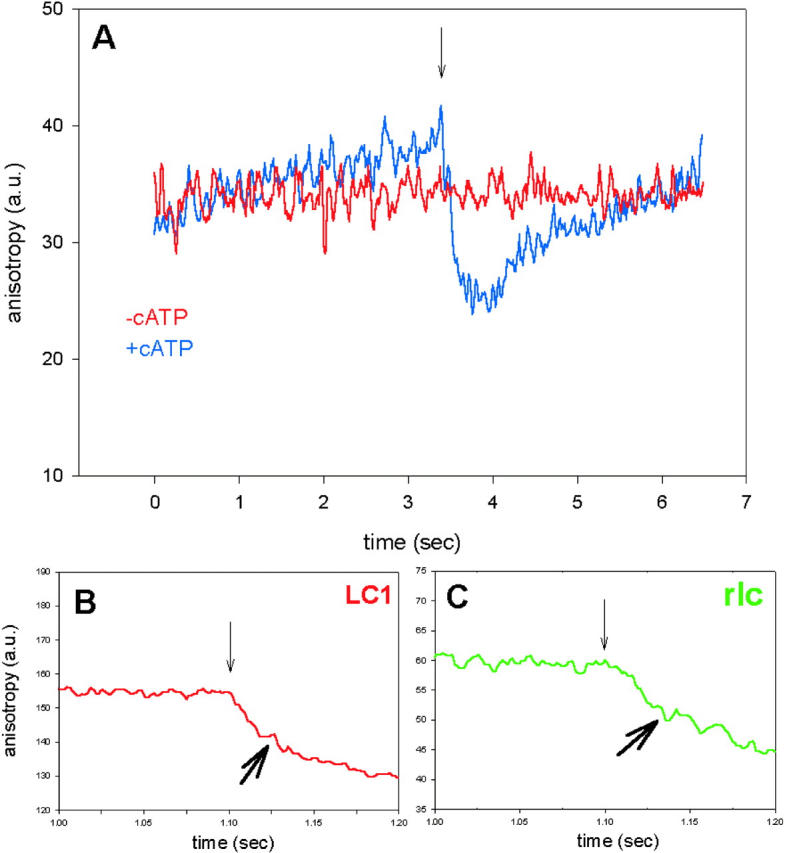
Anisotropy change during a single turnover of ATP. A muscle fiber containing fluorescently labeled LC3 (A), LC1 (B), or RLC (C) in Ca2+-rigor solution was illuminated (at the time indicated by downpointing arrows) with the 10-ms pulse of the UV light. (A) Anisotropy in the absence (red curve) and presence (blue curve) of 2 mM caged ATP. (B) Anisotropy of LC1 on myosin (heavy arrow indicates the inflection). (C) Anisotropy of RLC on myosin (heavy arrow indicates the inflection). Perpendicular anisotropy R⊥(t) = [(⊥I⊥(t) − ⊥I‖(t))/(⊥I⊥(t) + 2⊥I‖(t))] × 256 + 128.