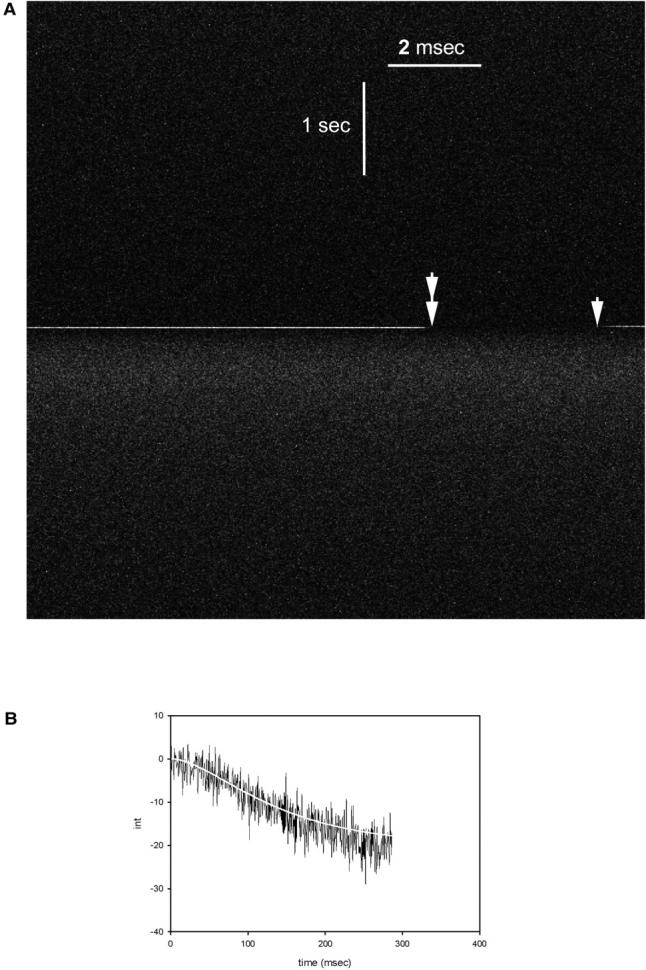
FIGURE 6.

(A) Changes in the horizontal intensity of fluorescence. The beginning and end of the UV pulse are indicated by single and double arrows. (B) The horizontal scan of intensity. Scan was begun when the light was turned off (double arrow). 11,444 data points were collected every 25 μs. (White line) The fit to the equation Mf = Mco[1 + (1/(kc − kdiss)(kdisse−kc×t − kce−kdiss×t)].
