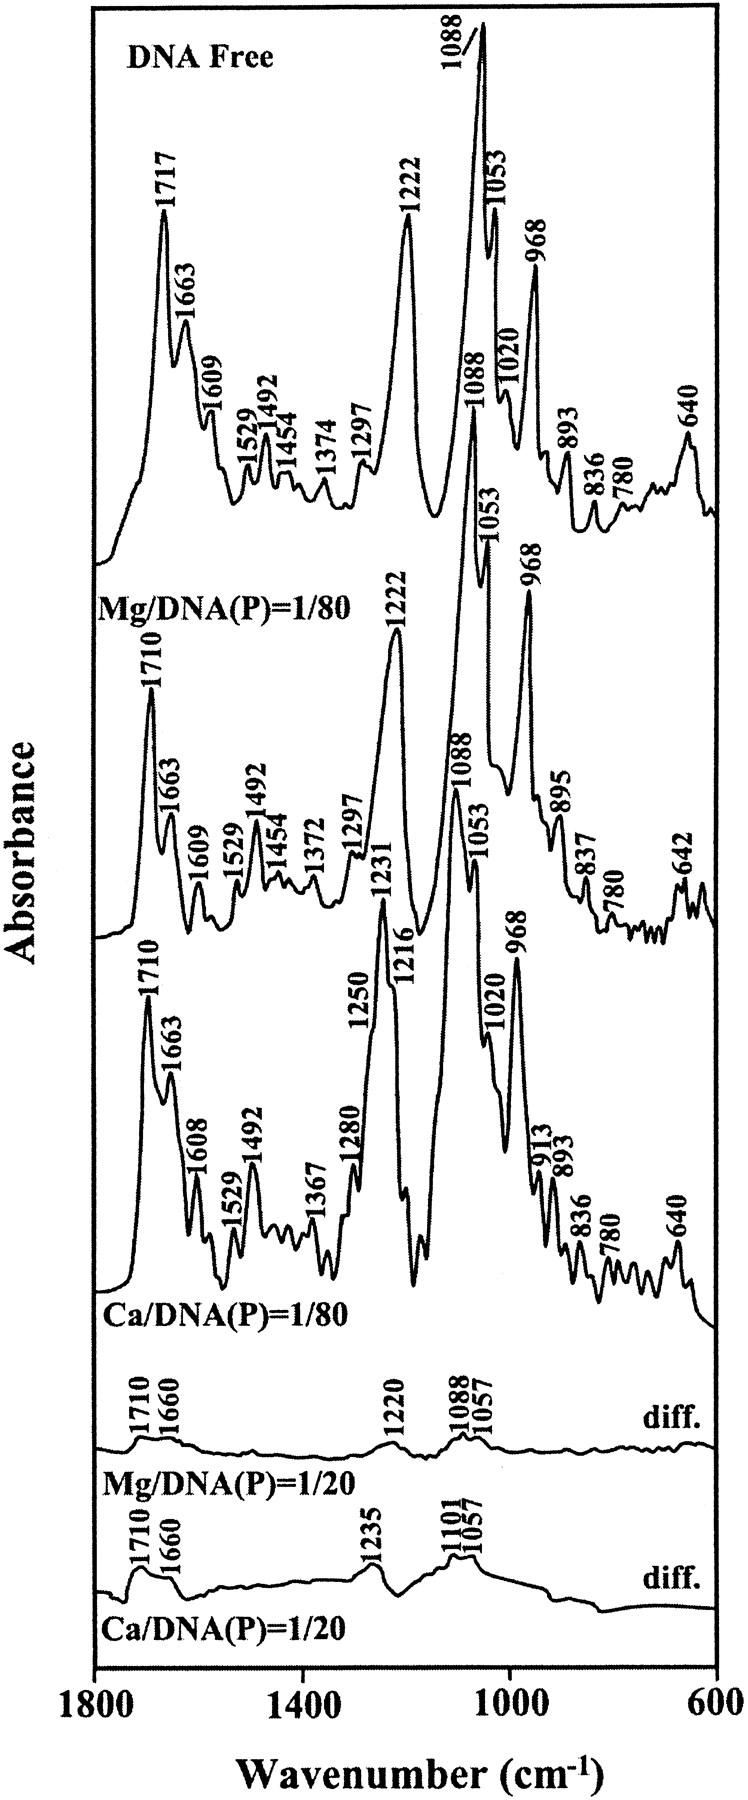
FIGURE 1.

FTIR spectra (top three curves) and difference FTIR spectra [(DNA solution + metal ion) − (DNA solution)] (two bottom curves) of the uncomplexed calf thymus DNA and its Mg and Ca complexes in aqueous solution at pH = 7.4 with various cation/DNA(P) molar ratios in the region of 1800–600 cm−1.
