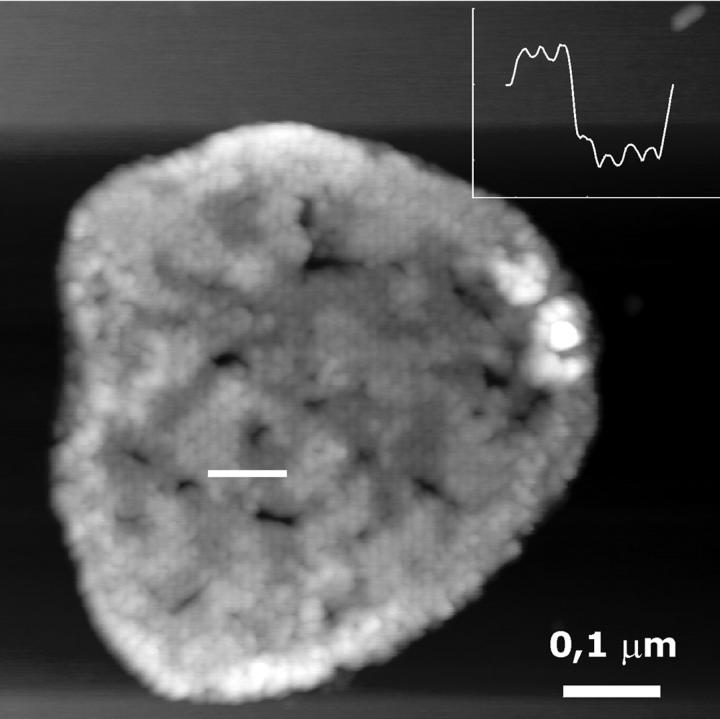
FIGURE 4.
TMAFM topograph of reconstituted light-harvesting 2 complexes in a lipid bilayer. The gray scale represents a height range of 15 nm. Thinner and thicker domains are observed in the imaged patch. (Inset) Section analysis along the white line in image showing the protrusions of the thinner and thicker domain. The height difference is 2 nm.

