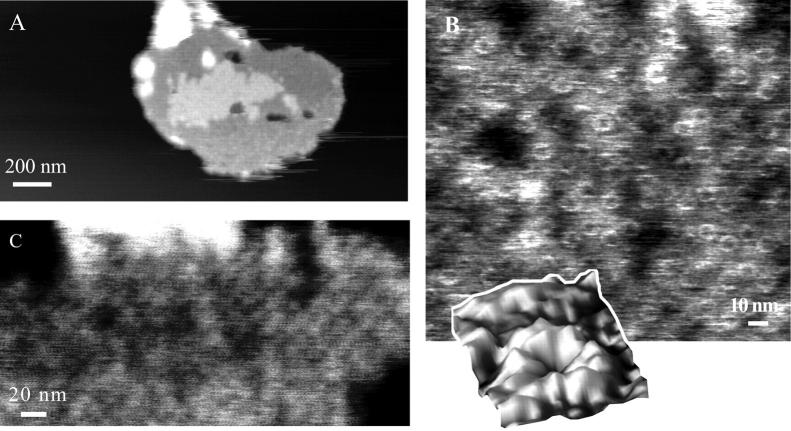
FIGURE 5.
(A) CMAFM topograph of reconstituted light-harvesting 2 complex in a lipid bilayer imaged in buffer D. The gray scale represents a height range of 20 nm. (B) High-resolution images on the thinner layer, revealing the ring structure of the LH2 complex. The gray scale represents a height range of 1.5 nm. (Inset) Single LH2 complex. (C) High-resolution image on the thicker layer. The gray scale represents a height range of 2 nm.

