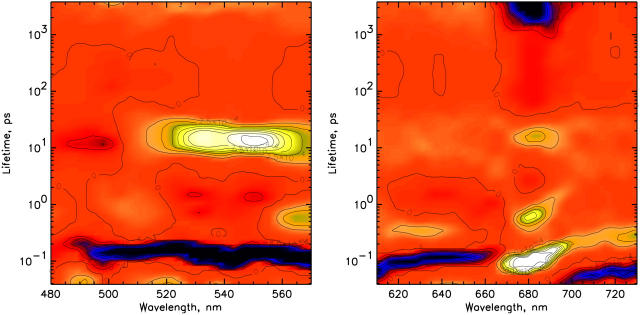
FIGURE 2.
Lifetime density maps for CP29-E166V for the 500-nm excitation in two detection ranges: 480–570 nm (left) and 610–730 nm (right). Note: The red background denotes the zero level. Positive amplitudes are shown in yellow/white color, whereas negative amplitudes are shown in blue/black color. It is important to note that in transient absorption spectra a positive amplitude in a DAS can mean either a decay of excited-state absorption or a rise in a bleaching signal. Likewise, a negative amplitude can either be a decay of the bleaching or the rise of an excited-state absorption signal. Which possibility applies must be decided upon analysis of the lifetime density map and the whole kinetics. The lifetime scale shown is a logarithmic scale. It is important to note that these color maps represent a qualitative or at best semiquantitative picture of the kinetics in a very condensed form. The density of the color has been chosen proportional to the amplitude, but due to printer and reproduction quality limitations, one should be careful in the quantitative interpretation of the amplitudes based on these maps. Any quantitative information should only be deduced from the actual numerical amplitude distribution function underlying this surface.

