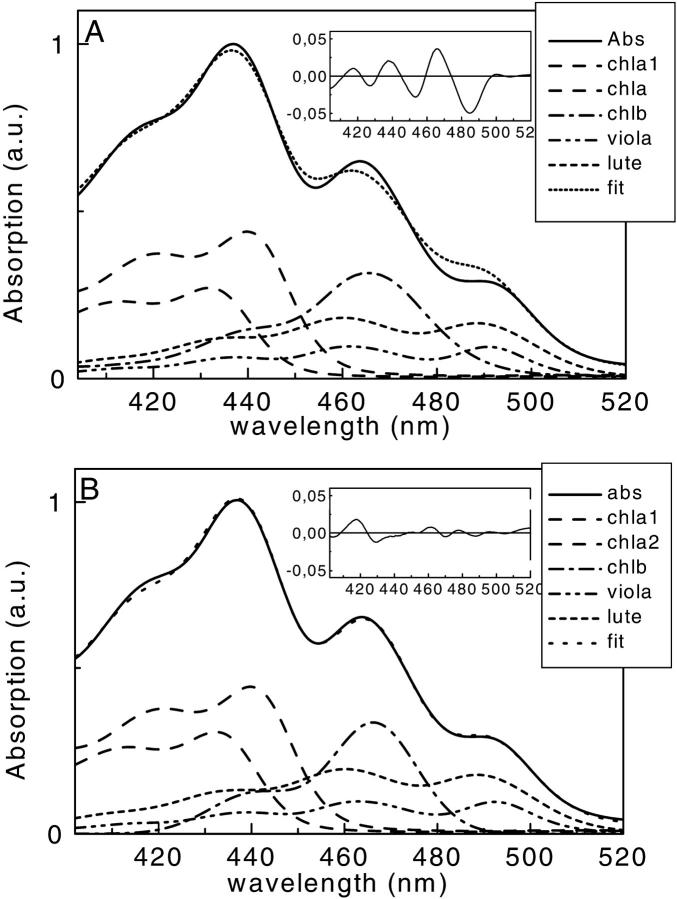
FIGURE 9.
Decomposition of the 400- to 520-nm region of the absorption spectrum of the CP29-E166V mutant in terms of the absorption of single pigments. (A) Using, for Chl b, the Chl-b spectral shape in solution, and (B) using the narrower spectral shape for Chl b in protein. (Insets) Errors for the two fittings are shown.

