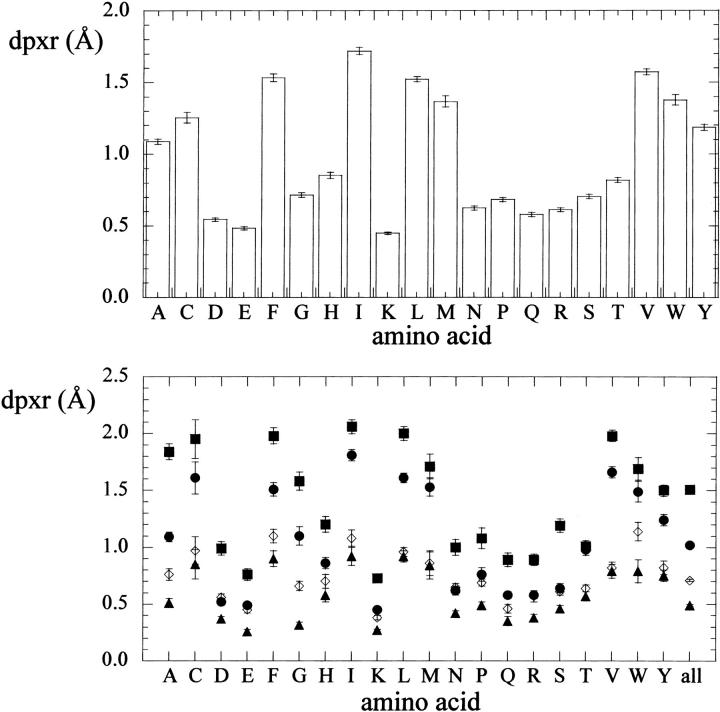
FIGURE 4.
Plot of the mean residue depth (dpxr, Å) for each amino acid type (one-letter code), calculated from a set of 136 protein structures (see text for details). Top, overall; bottom, by secondary structure assignment (square, strand; circle; helix; triangle: turn, diamond, coil). Standard deviation values are also shown.

