
FIGURE 6.
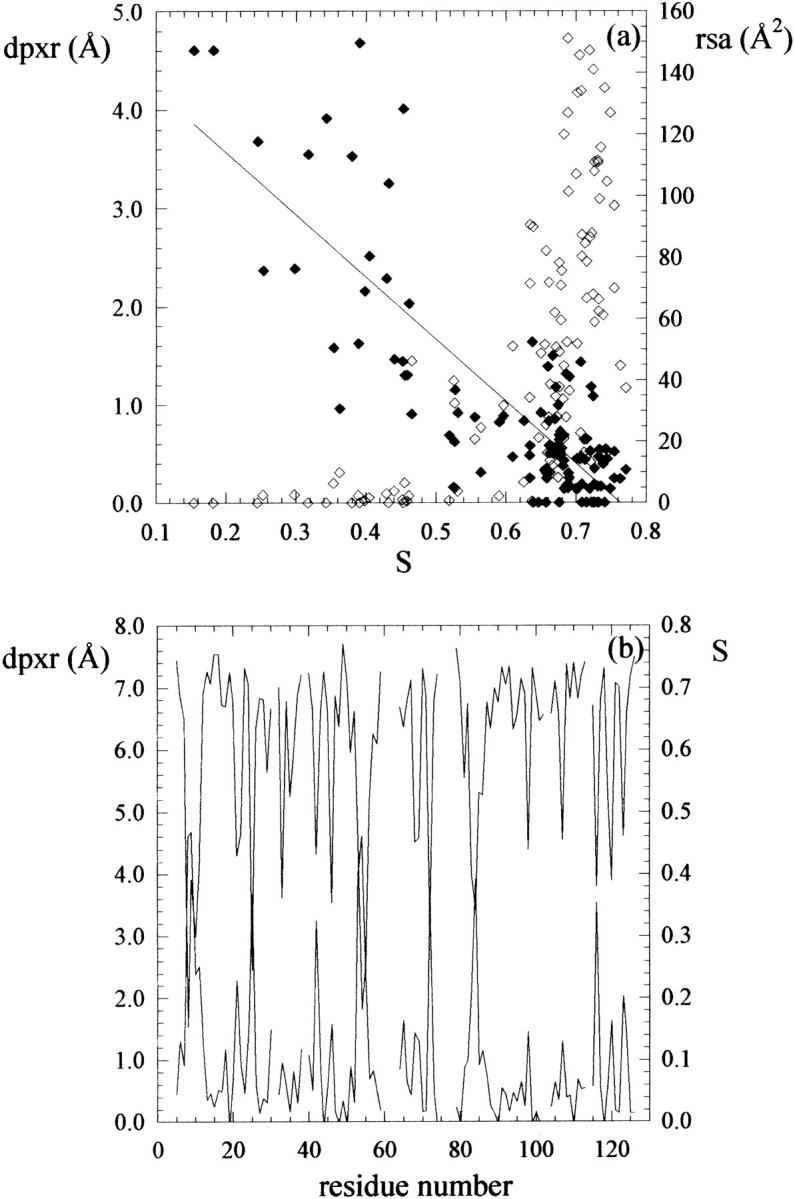
(a) Mean residue depth (dpxr, Å, filled diamonds) and residue-solvent accessibility (rsa, Å2, empty diamonds) calculated for 3CHY and plotted versus sequence entropy (S) calculated for 98 structural neighbors of 3CHY. (b) Mean residue depth (dpxr, Å, lower line) and sequence entropy (S, upper line) plotted versus residue number. In a, also a linear fit of dpxr is shown. In b, line breaks represent positions at which less than two-thirds of residues could be aligned.