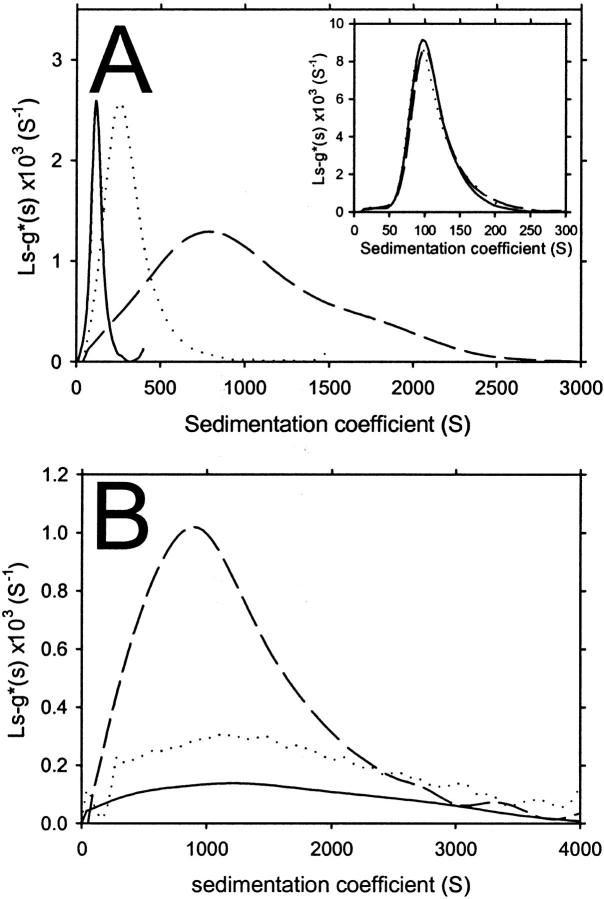
FIGURE 2.
Continuous sedimentation coefficient distributions of apoC-II amyloid fibrils determined using ls-g*(s) analysis of sedimentation velocity data. (A) ApoC-II fibrils formed by one-week incubation at 0.3 (solid line), 0.7 (dotted line), and 1.0 mg/mL (dashed line), from data acquired at 4000 rpm (the raw data and fits are shown in Fig. 1). (Inset) ApoC-II fibrils formed by one-week incubation at 0.3 mg/mL, from data acquired at 4000 rpm (solid line), 8000 rpm (dotted line), and 10,000 rpm (dashed line). (B) ApoC-II fibrils formed by one-week incubation at 1 mg/mL, with centrifugation performed with samples undiluted (dashed line), diluted twofold (dotted line), or diluted fourfold (solid line).

