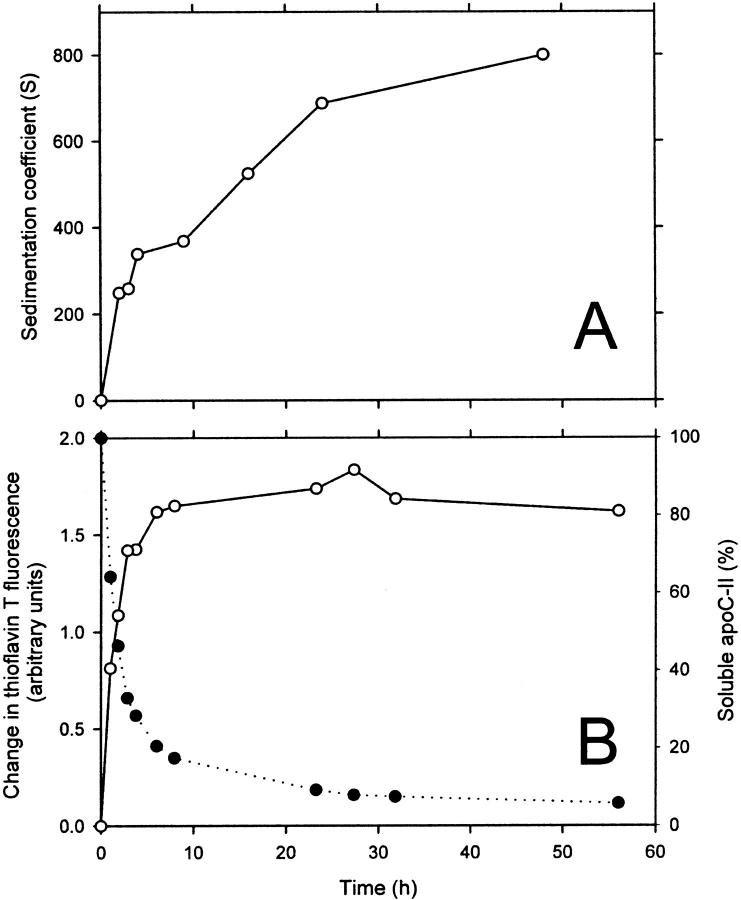
FIGURE 4.
(A) Modal sedimentation coefficient of 1 mg/mL apoC-II as a function of time, determined from the data in Fig. 3. (B) Time course of amyloid formation (1 mg/mL) as measured by thioflavin T reactivity (left axis, open circles) and pelleting and assay of the supernatant for fluorescamine reactivity (right axis, closed circles).

