
FIGURE 5.
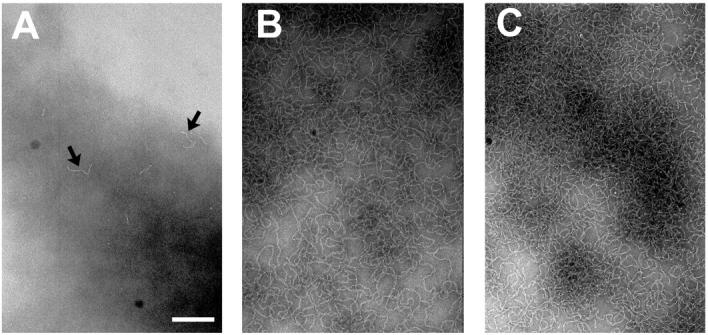
Negative staining electron microscopy of apoC-II (1 mg/mL) as a function of incubation time. (A) 30 s. (B) 60 min. (C) Two days. Scale bar = 200 nm. Arrows in panel A highlight nascent fibrils.
Official websites use .gov
A
.gov website belongs to an official
government organization in the United States.
Secure .gov websites use HTTPS
A lock (
) or https:// means you've safely
connected to the .gov website. Share sensitive
information only on official, secure websites.
Negative staining electron microscopy of apoC-II (1 mg/mL) as a function of incubation time. (A) 30 s. (B) 60 min. (C) Two days. Scale bar = 200 nm. Arrows in panel A highlight nascent fibrils.