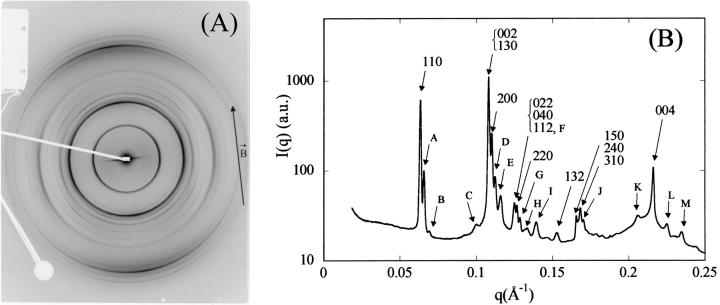
FIGURE 3.
(A) Diffraction pattern recorded on the ESRF ID2 beam line at an added salt concentration of 160 mM under an osmotic pressure of 4.7 × 10⁵ Pa (PEG 19%). This sample had been partially oriented in a 10-T magnetic field during 15 days. The initial NCP concentration before osmotic stress was applied was equal to 260 mg/ml. The pattern was recorded 4 months after capillary preparation. (B) Profile of the integrated intensity I(q) over 360°. The Bragg reflections noted A to M could correspond to a superstructure along c-axis of a periodicity close to 6c. They can be indexed as: A (1, 1, 2δ), B (1, 1, 3δ), C (0, 2, 1 + 3δ), D (1, 3, 3δ), E (0, 0, 2 + δ), F (0, 0, 2 + 2δ), G (0, 4, 3δ) and (2, 2, 3δ), H (0, 0, 2 + 3δ), I (2, 1, 1 + 3δ), J (3, 1, 3δ), K (3, 3, 1 + 3δ), L (0, 0, 4 + δ), M (0, 0, 4 + 2δ), where δ is close to 1/6.

