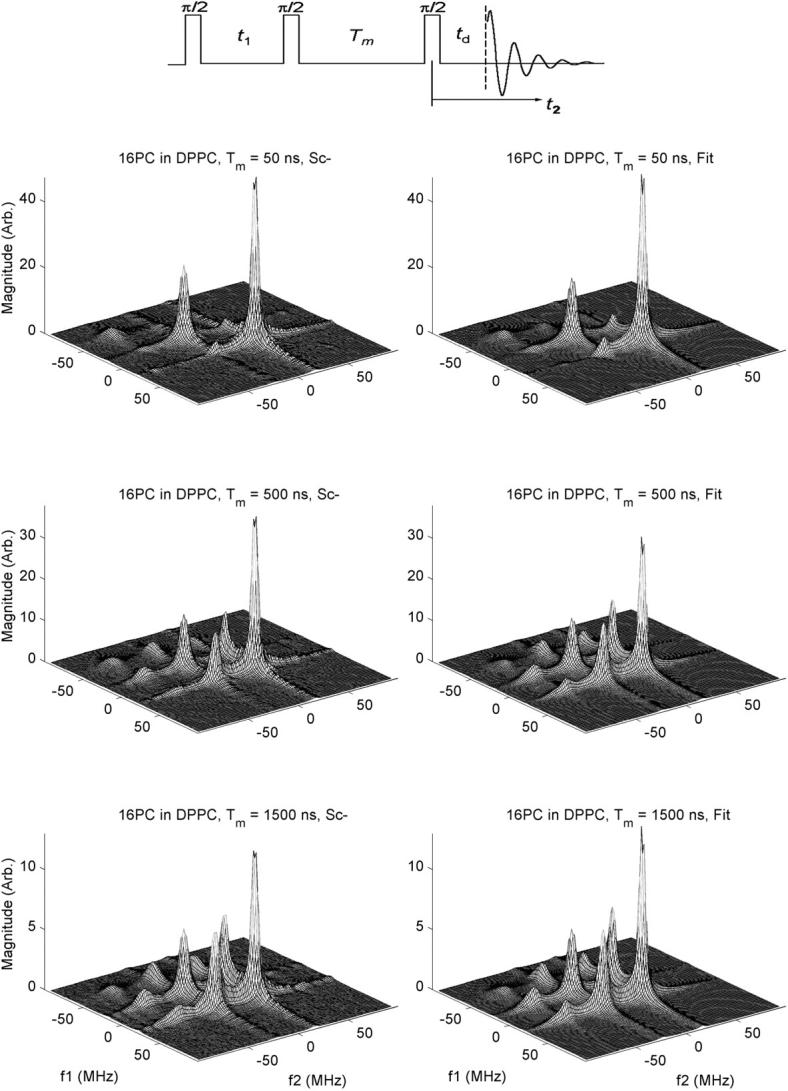
FIGURE 2.

Experimental 2D-ELDOR spectra (left side) and their best-fit simulations (right side) for 16-PC in pure DPPC vesicles for values of mixing time Tm = 50, 500, and 1,500 ns. In the inset above are shown the three π/2 pulse sequence used for the 2D-ELDOR experiment as well as the relevant times: t1, t2, Tm, and td. The frequencies f1 and f2 are given relative to the applied microwave frequency.
