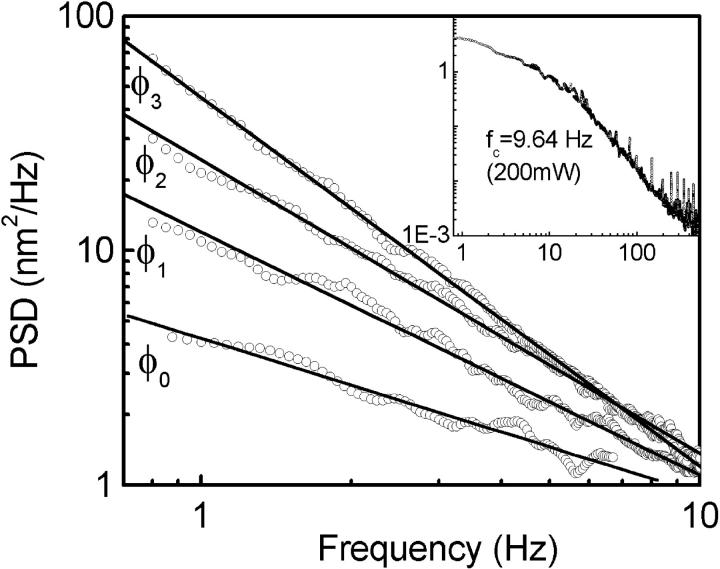
FIGURE 4.
(A) The PSD of trapped bead fluctuations using the 200-mW laser trap is plotted against frequency (f < fc), with and without bacteria at different concentrations as shown. The solid lines are the linear fits in the white noise regime. Inset shows the PSD for φ = 0, for full frequency range to deduce the corner frequency.

