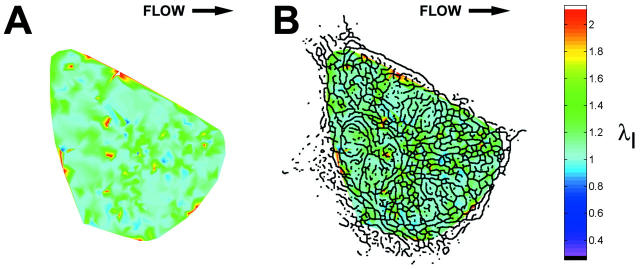
FIGURE 4.
IF strain field in an optical section. (A) Magnitude (color scale) of principal stretch ratio λI during a 3-min interval immediately after onset of shear stress (12 dyn/cm2, left to right). (B) Skeleton image superimposed on magnitude of principal stretch as a spatial reference. Note strain focusing at dense interconnections among IF segments.

