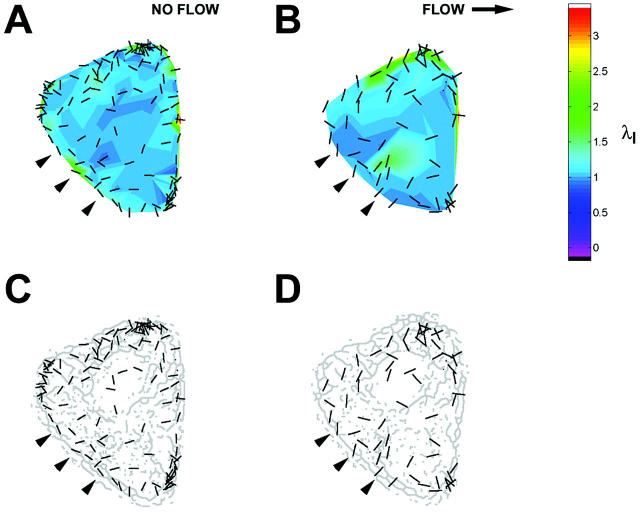
FIGURE 6.
Reorientation of principal stretch direction near the upstream cell boundary during onset of shear stress. (A and B) Magnitude (color scale) and orientation (bars) of principal stretch ratio λI in an optical section located 2.4 μm above the coverslip during consecutive 3-min intervals (A) before and (B) after onset of shear stress (12 dyn/cm2, left to right). (C and D) Comparison of orientation of principal stretch (bars) with skeleton morphology. Along the upstream edge, onset of shear stress induced a change of orientation (arrowheads) from parallel to IF along the cell edge to perpendicular.

