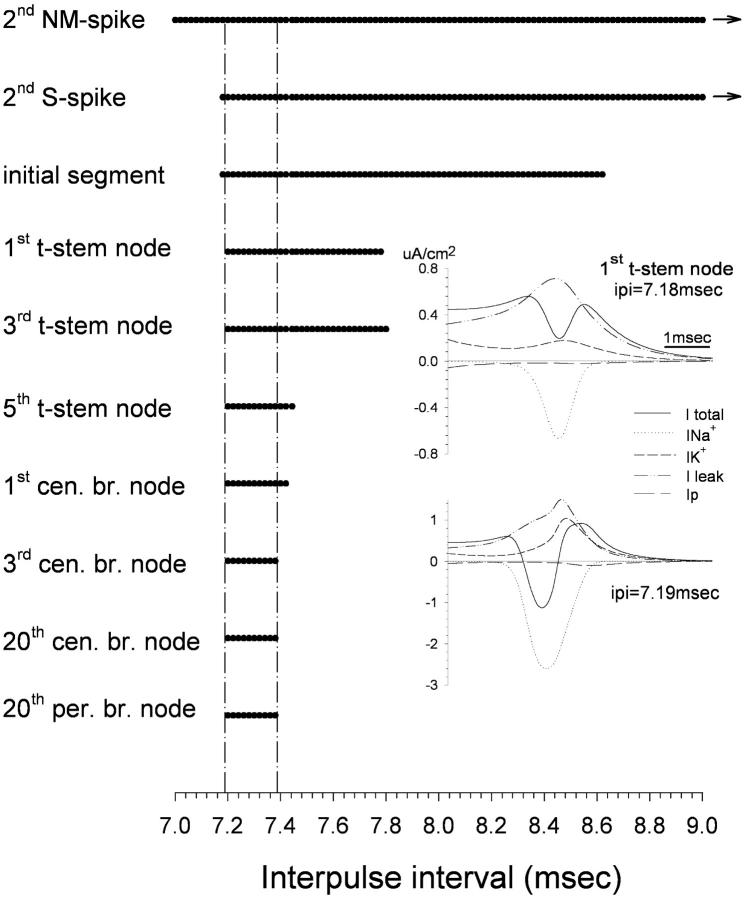
FIGURE 5.
Extra spikes are generated in the t-stem axon over a broader range of IPI values than support propagation into the main conducting axons. The two top horizontal lines indicate the range of IPI values for which a second NM- and S-spike were present in the cell soma. The remaining horizontal lines show the range of IPI values for which a criterion extra spike was present at the recording locations marked on the left. Insets show transmembrane currents at the first node of the stem axon using IPI = 7.18 ms (upper) and IPI = 7.19 ms (lower). The net current (I total) first became inward for IPI = 7.19 ms, the minimum IPI value for evoking propagated extra spikes.

